Scrape Metrics from Appliances
In order to configure Prometheus to scrape the metrics from Web Safety appliances we would need to save the following configuration file to /etc/prometheus/prometheus.yml.
Note, how we configure 4 jobs for Prometheus and each job collects corresponding metrics from all web safety appliances. Also note how relabel_configs section in each job adds the appliance label to collected metrics. This label is very important and is used in Grafana dashboards (see following article).
# my global config
global:
  scrape_interval: 15s # Set the scrape interval to every 15 seconds. Default is every 1 minute.
  evaluation_interval: 15s # Evaluate rules every 15 seconds. The default is every 1 minute.
  # scrape_timeout is set to the global default (10s).

#
# alertmanager configuration
#
alerting:
  alertmanagers:
    - static_configs:
      - targets:
        - localhost:9093

#
# alerting rules periodically evaluated
#
rule_files:
  - "websafety_alerts.yml"

#
# scrape configuration
#
scrape_configs:

  #
  # sample job for this same prometheus instance
  #
  - job_name: "prometheus"

    # metrics_path defaults to '/metrics'
    # scheme defaults to 'http'.

    static_configs:
      - targets: ["localhost:9090"]

  #
  # we have jobs for node, perf, squid and process on each virtual appliance
  # node how __address__ gets relabelled into instance which is used in
  # grafana dashboards later
  #
  - job_name: "websafety_node"
    static_configs:
      - targets:
        - "192.168.4.12:9090"
        - "192.168.4.14:9090"
        labels:
          app: websafety
    metrics_path: /metrics/node
    relabel_configs:
    - source_labels: [__address__]
      target_label: instance
      regex: (.*)[:].+

  - job_name: "websafety_perf"
    static_configs:
      - targets:
        - "192.168.4.12:9090"
        - "192.168.4.14:9090"
        labels:
          app: websafety
    metrics_path: /metrics/perf
    relabel_configs:
    - source_labels: [__address__]
      target_label: instance
      regex: (.*)[:].+

  - job_name: "websafety_squid"
    static_configs:
      - targets:
        - "192.168.4.12:9090"
        - "192.168.4.14:9090"
        labels:
          app: websafety
    metrics_path: /metrics/squid
    relabel_configs:
    - source_labels: [__address__]
      target_label: instance
      regex: (.*)[:].+

  - job_name: "websafety_process"
    static_configs:
      - targets:
        - "192.168.4.12:9090"
        - "192.168.4.14:9090"
        labels:
          app: websafety
    metrics_path: /metrics/process
    relabel_configs:
    - source_labels: [__address__]
      target_label: instance
      regex: (.*)[:].+
Unfortunately, for now this config cannot be simplified, thus if you decide to add another Web Safety appliance to the scrape configuration, you need to add it to all scrape jobs.
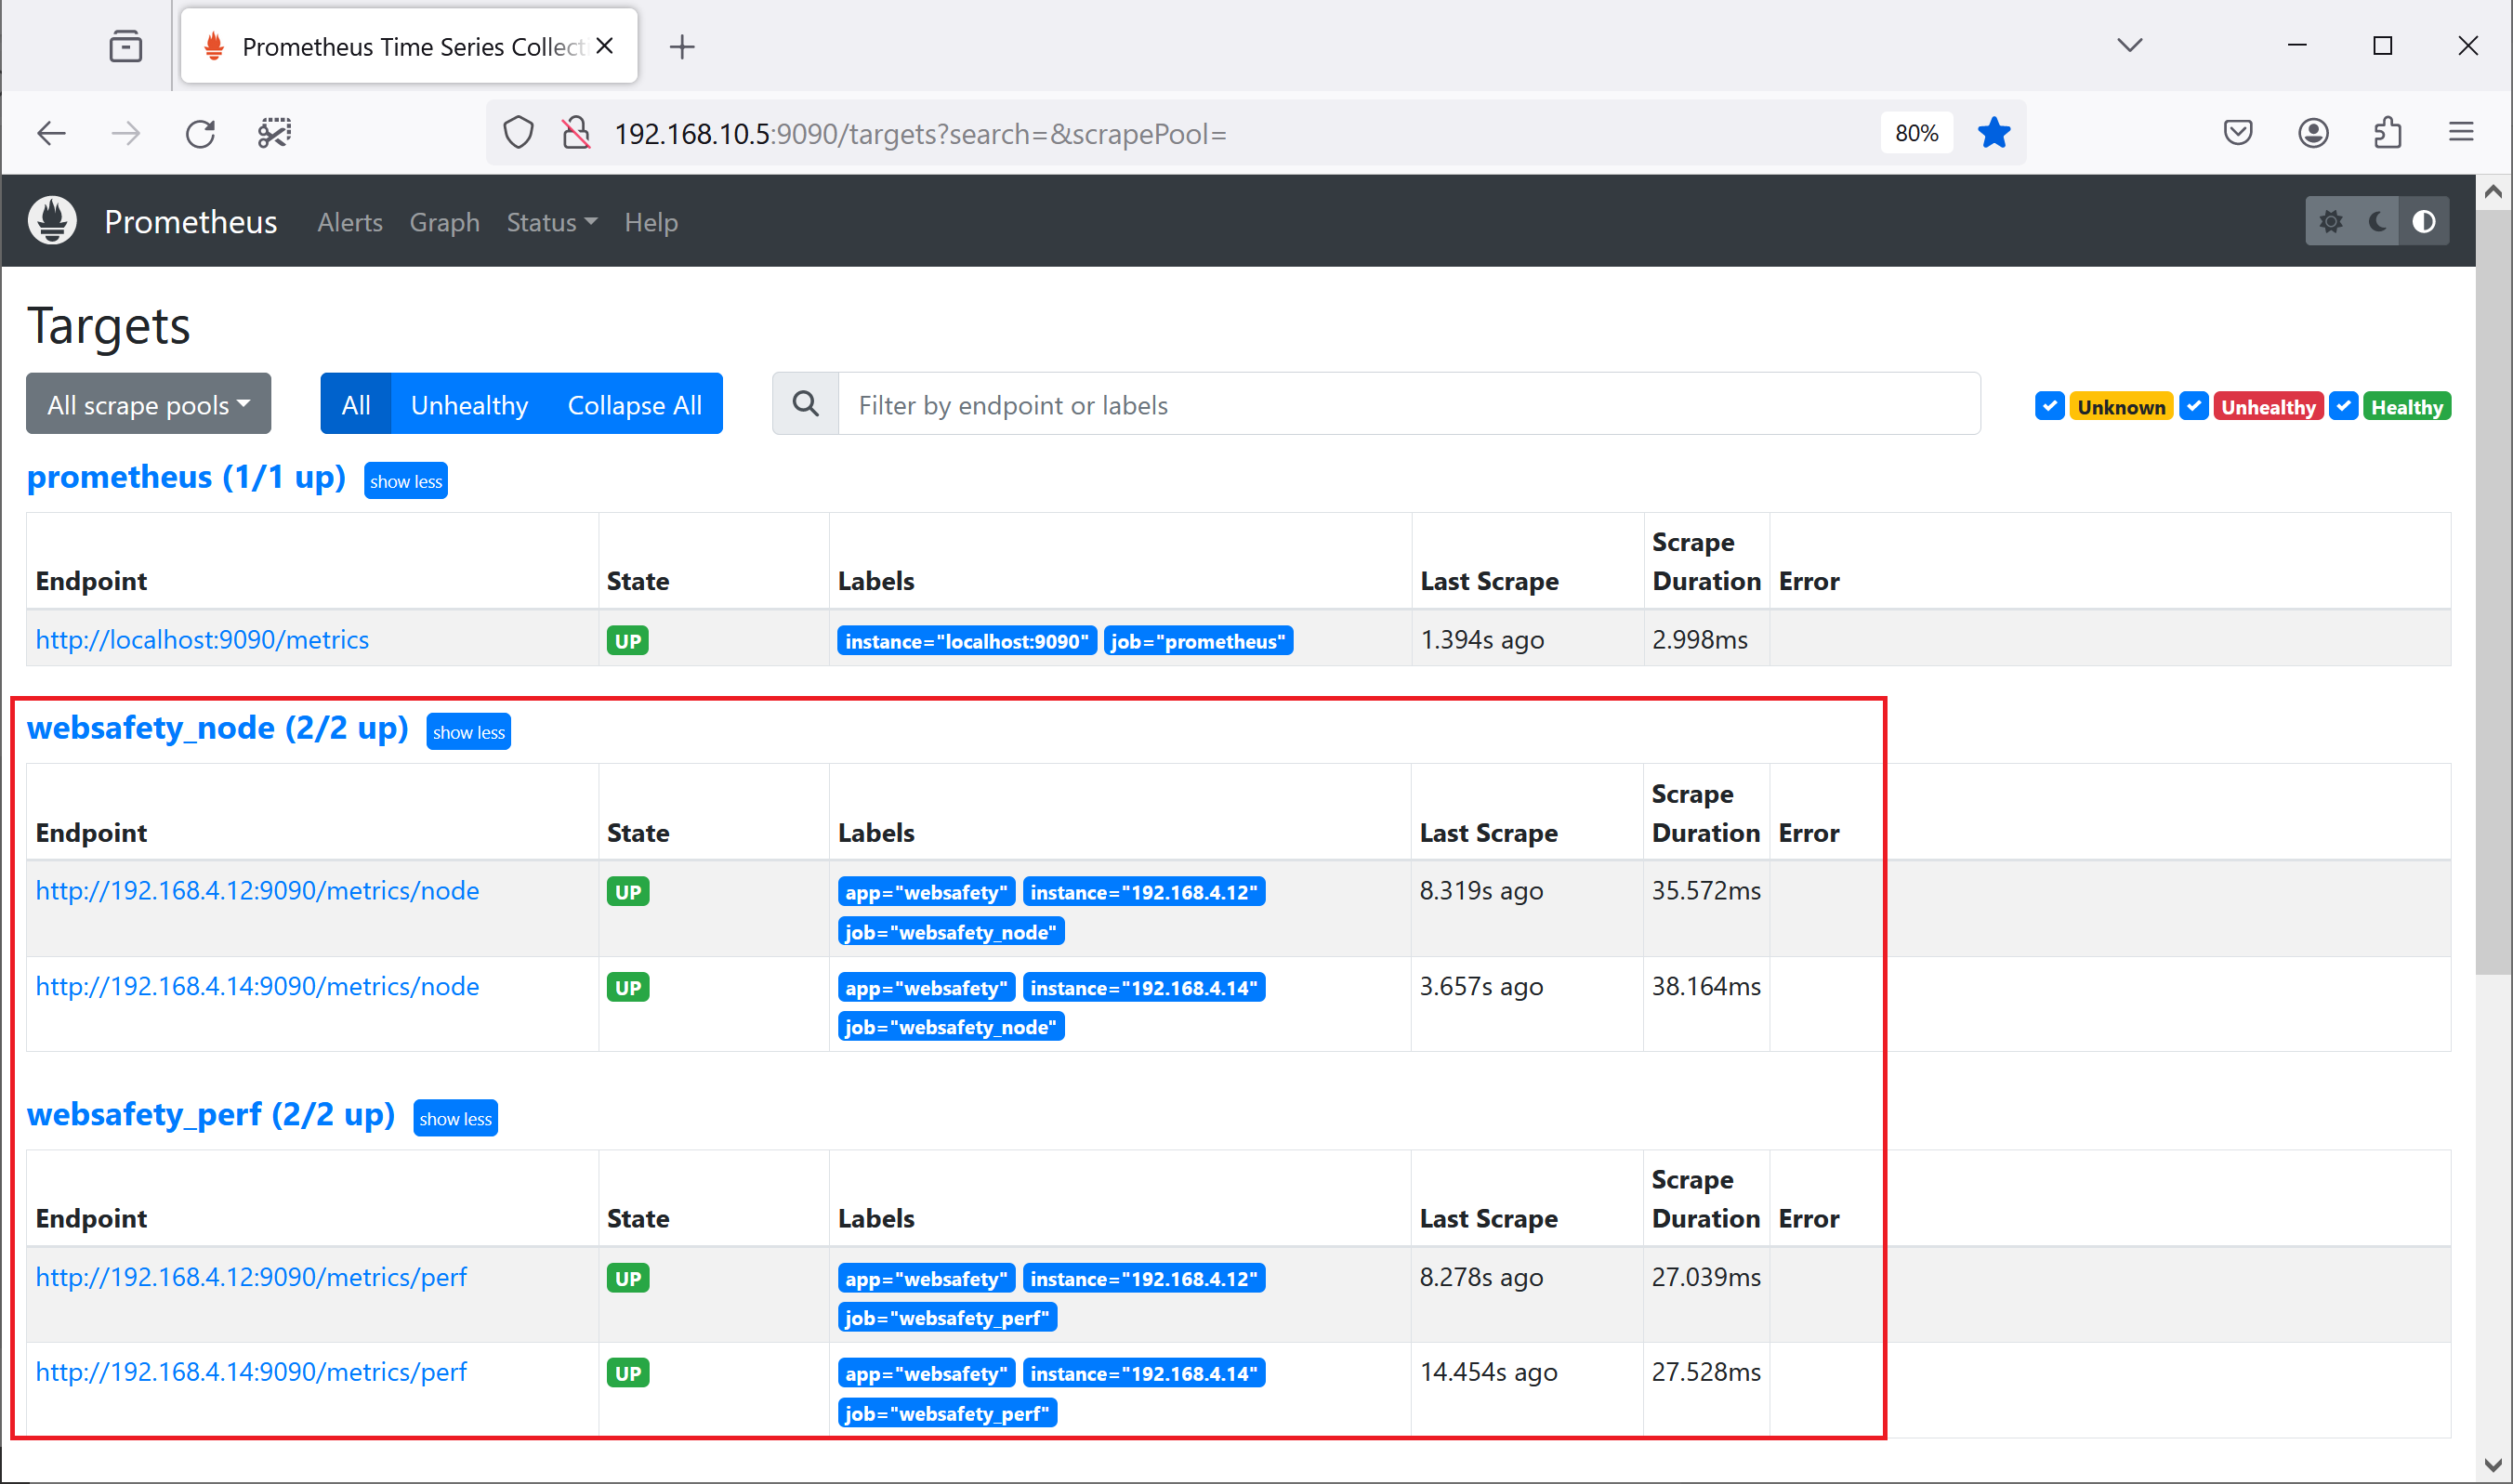
After restarting Prometheus with systemctl restart prometheus we should have all scrape jobs in Up status for all our appliances which can be checked in Prometheus UI / Status / Targets page.
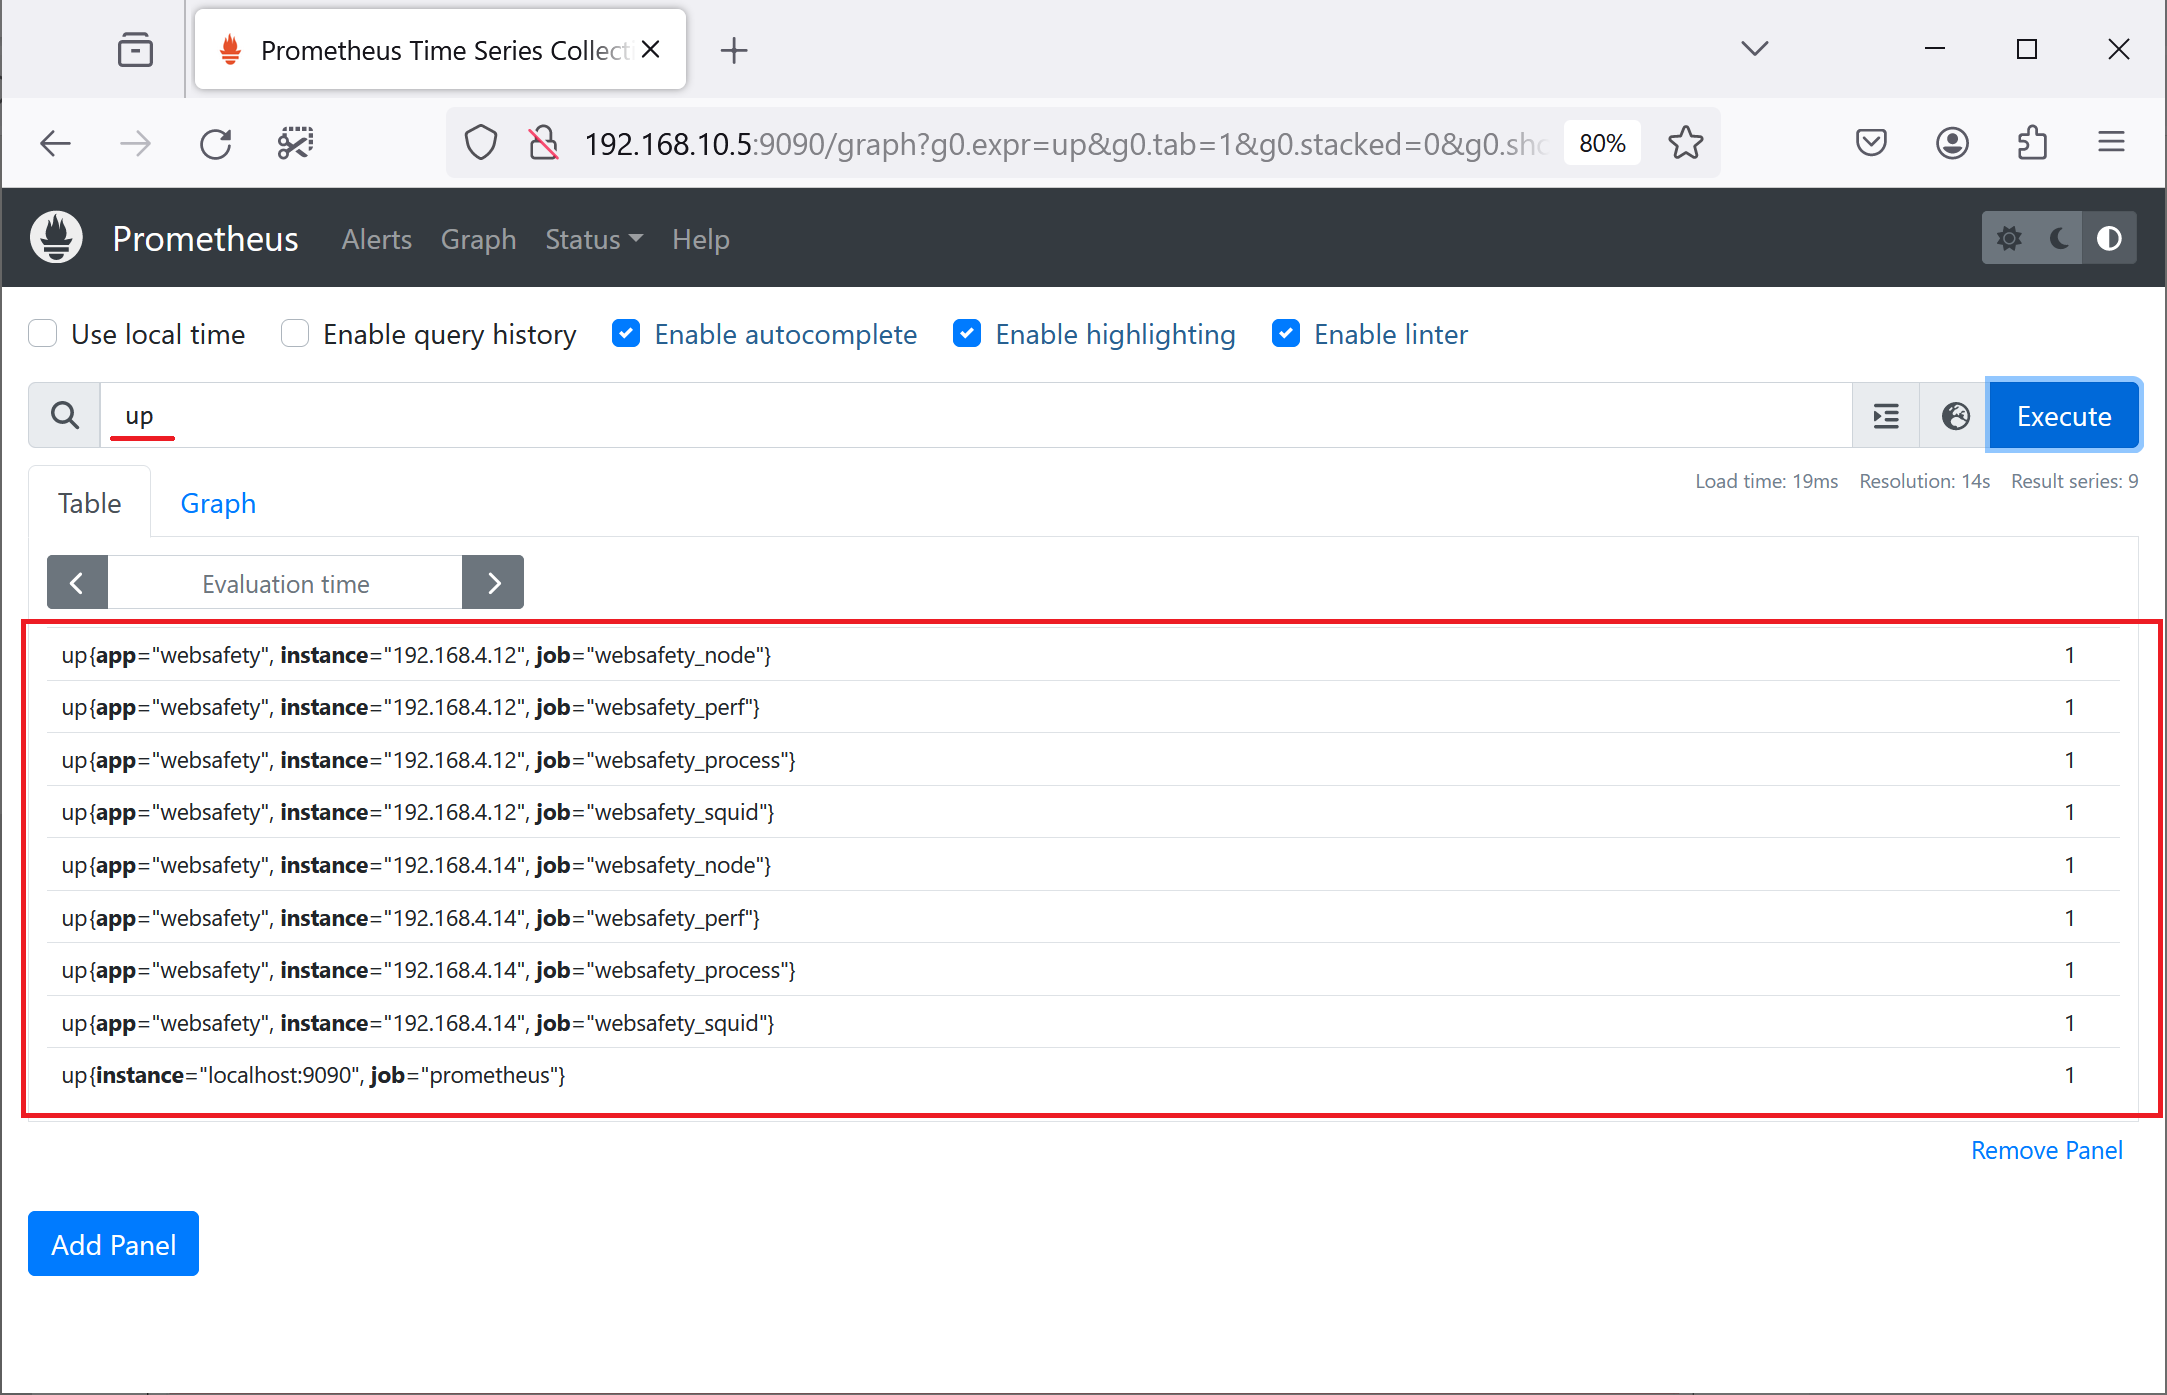
The up metrics in Prometheus UI should also show 1 for all scrape jobs.
Good, next step is to use Grafana Dashboards to finally visualize all these collected metrics.