Alert Manager
Alert Manager provides automatic alerting based on metrics stored in Prometheus server.
Install Alert Manager
To install Alert Manager run 04_alertmanager.sh as root user on the monitoring server.
#!/bin/bash

# all packages are installed as root
if [[ $EUID -ne 0 ]]; then
   echo "This script must be run as root" 1>&2
   exit 1
fi

# install lts version of alert manager
VERSION="0.27.0"

# download
wget https://github.com/prometheus/alertmanager/releases/download/v${VERSION}/alertmanager-${VERSION}.linux-amd64.tar.gz

# extract contents and remove original archive
tar xvfz alertmanager-${VERSION}.linux-amd64.tar.gz && rm alertmanager-${VERSION}.linux-amd64.tar.gz

# create folders to install
mkdir /var/lib/alertmanager

# change into extracted folder
pushd alertmanager-${VERSION}.linux-amd64

# move to bin and etc
mv alertmanager amtool /usr/local/bin/
mv alertmanager.yml /etc/prometheus/alertmanager.yml
#mv consoles/ console_libraries/ /etc/prometheus/

# return to parent folder
popd

# and check prometheus is installed
alertmanager --version

# create systemctl service file
cat >/etc/systemd/system/alertmanager.service << EOL
[Unit]
Description=Alert Manager
Wants=network-online.target
After=network-online.target

[Service]
User=prometheus
Group=prometheus
Type=simple
Restart=on-failure
RestartSec=5s
ExecStart=/usr/local/bin/alertmanager \
    --config.file /etc/prometheus/alertmanager.yml \
    --storage.path /var/lib/alertmanager/ \
    --log.level=info

[Install]
WantedBy=multi-user.target
EOL

# reload the systemd, enable the service and check its status
systemctl daemon-reload
systemctl enable alertmanager
systemctl restart alertmanager

# good then
systemctl status alertmanager
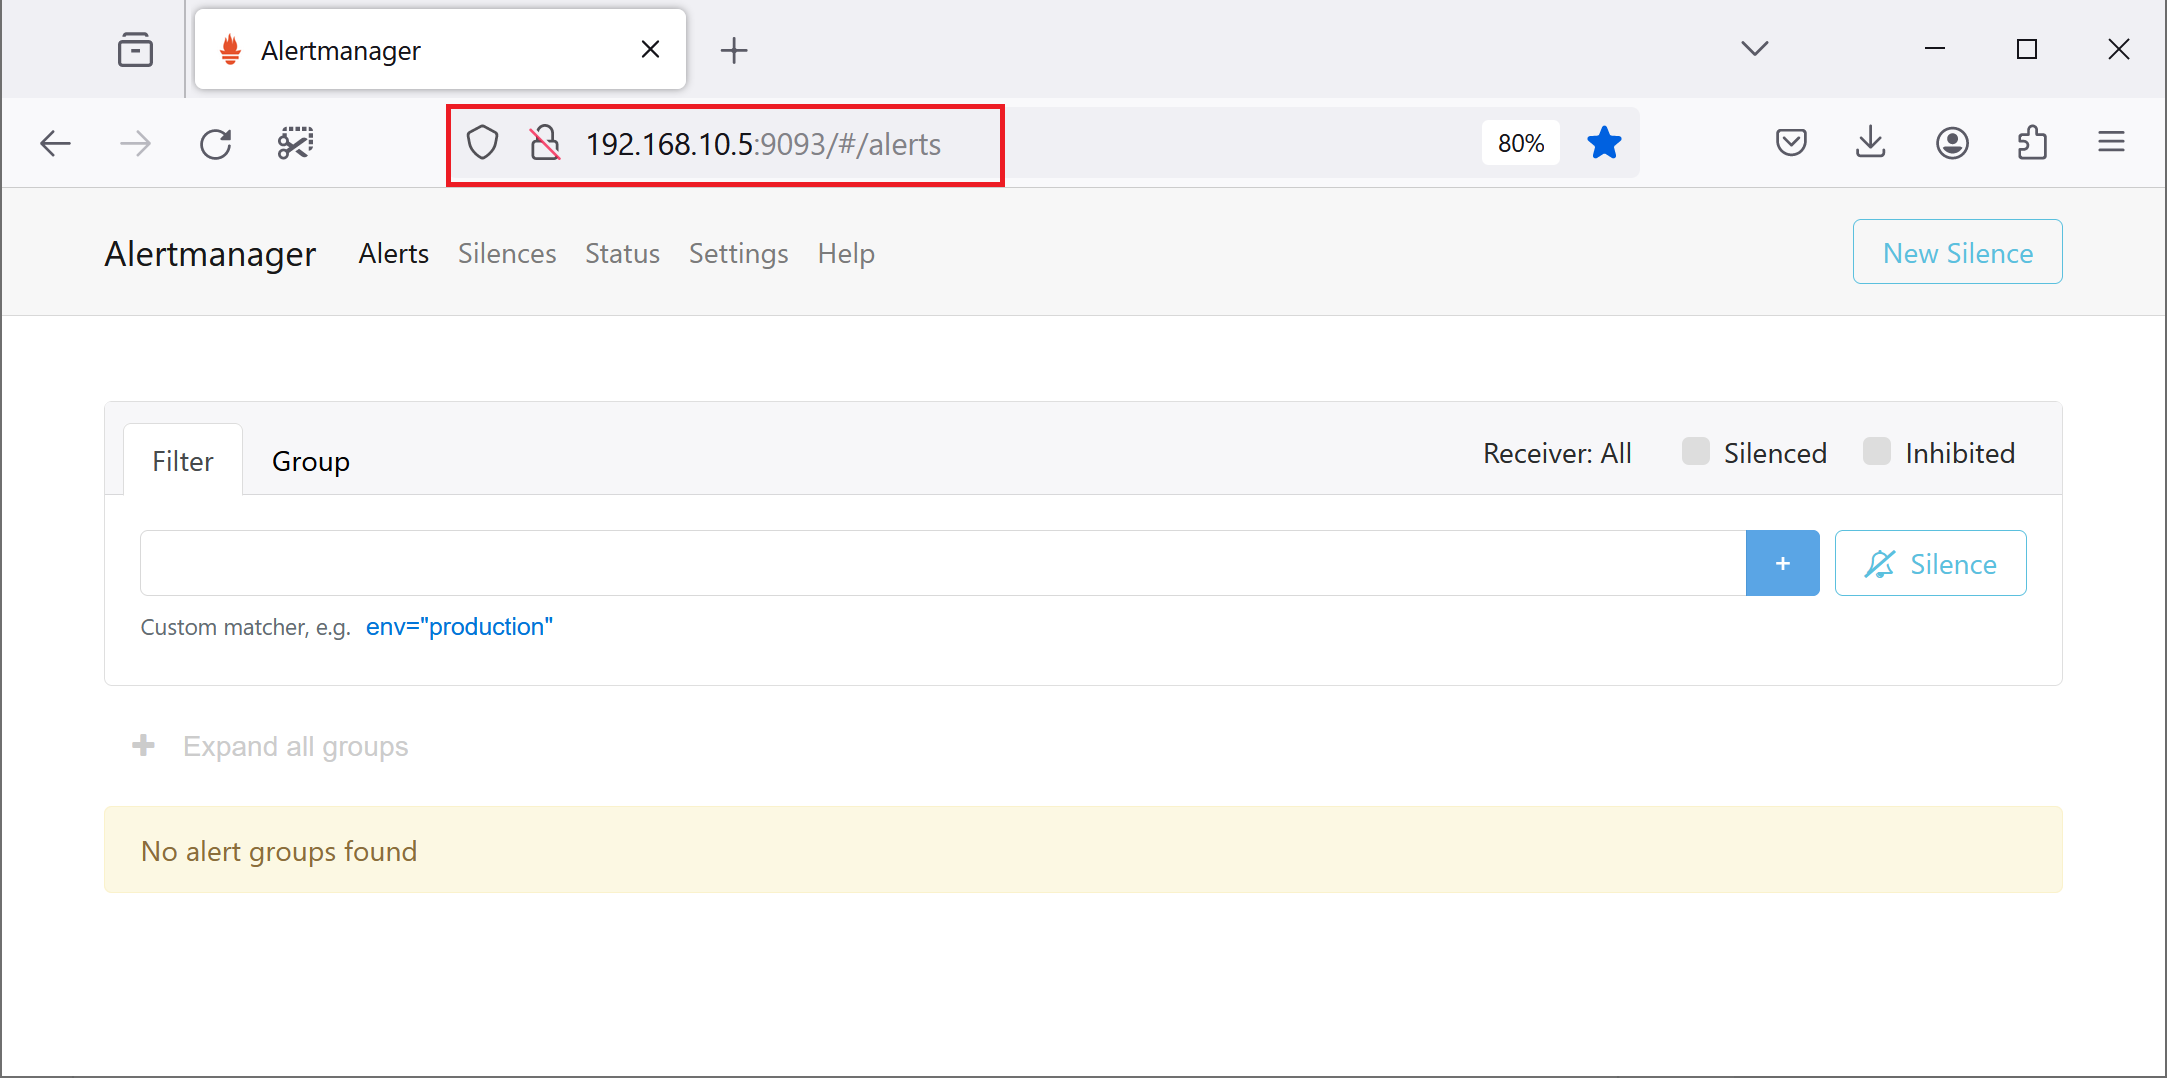
After this script finishes successfully, systemctl status alertmanager command should show running Alert Manager server and Alert Manager Admin UI should also be visible at the IP address of the monitoring server, port 9093.
* alertmanager.service - Alert Manager
     Loaded: loaded (/etc/systemd/system/alertmanager.service; enabled; vendor preset: enabled)
     Active: active (running) since Thu 2024-05-16 12:23:37 UTC; 17h ago
   Main PID: 828 (alertmanager)
      Tasks: 8 (limit: 4558)
     Memory: 36.5M
        CPU: 35.167s
     CGroup: /system.slice/alertmanager.service
             └─828 /usr/local/bin/alertmanager --config.file /etc/prometheus/alertmanager.yml
We would now need to configure the receiver of the alerts. This is done in /etc/prometheus/alertmanager.yml file.
Alert Manager supports a lot of receivers, but as we use MS Teams internally, sample integration is done using Incoming WebHooks API, see more info at https://prometheus.io/docs/alerting/latest/configuration/#msteams_config. The URL here is just a sample, but your actual URL should look similar. Note the lines are wrapped in this example, but actual lines must not be.
route:
  receiver: 'teams'

receivers:
  - name: 'web.hook'
    webhook_configs:
      - url: 'http://127.0.0.1:5001/'

  - name: 'teams'
    msteams_configs:
      - webhook_url: 'https://blabla.webhook.office.com/webhookb2/
           bafdbe36-728a-476b-9c91-9755a2102aa3@057485d6-aa30-424a-aa6
           6-b668b2cb137b/IncomingWebhook/94e7c1fce1054e038fc55bb
           61e16bba5/42f6afa4-41ac-4672-99f6-93a4099d46bd'
Integrate Alert Manager and Prometheus
To integrate Alert Manager with Prometheus we need to add the following entries to /etc/prometheus/prometheus.yml. The Prometheus server will then look for Alert Manager on localhost, port 9090 and load alerting rules from our file /etc/prometheus/websafety_alerts.
#
# alertmanager configuration
#
alerting:
  alertmanagers:
    - static_configs:
      - targets:
        - localhost:9093

#
# Load rules once and periodically evaluate them according to the global 'evaluation_interval'.
#
rule_files:
  - "websafety_alerts.yml"
Configure Alert Rules
The websafety_alerts.yml file should be copied from https://github.com/diladele/websafety/blob/release-9.2/appliance/perf/server/websafety_alerts.yml to /etc/prometheus/websafety_alerts.yml and should contain the following alerts.
groups:
  - name: websafety
    rules:

      #
      # websafety appliance is down
      #
      - alert: InstanceDown
        expr: up{job="websafety_node", app="websafety"} == 0
        for: 5m
        labels:
          severity: critical
        annotations:
          summary: "Web Safety Appliance {{ $labels.instance }} is down for more than 5 minutes"

      #
      # websafety appliance has low disk space
      #
      - alert: InstanceLowDiskSpace
        expr: ((node_filesystem_avail_bytes{app='websafety', mountpoint='/'}) / (node_filesystem_size_bytes{app='websafety', mountpoint='/'}) * 100) > 90
        labels:
          severity: critical
        annotations:
          summary: "Web Safety Appliance {{ $labels.instance }} runs low on the HDD space available"

      #
      # websafety appliance has low RAM
      #
      - alert: InstanceLowMemory
        expr: ((node_memory_MemAvailable_bytes{app='websafety'}) / (node_memory_MemTotal_bytes{app='websafety'}) * 100) < 10
        for: 5m
        labels:
          severity: critical
        annotations:
          summary: "Web Safety Appliance {{ $labels.instance }} runs low on the RAM for more than 5 minutes"

      #
      # websafety appliance high CPU
      #
      - alert: InstanceHighCPUUsage
        expr: 100 * (1 - avg by(instance)(irate(node_cpu_seconds_total{mode='idle'}[1m]))) >= 80
        for: 5m
        labels:
          severity: warning
        annotations:
          summary: "Web Safety Appliance {{ $labels.instance }} has high CPU usage for more than 5 minutes"
Verify Alerts
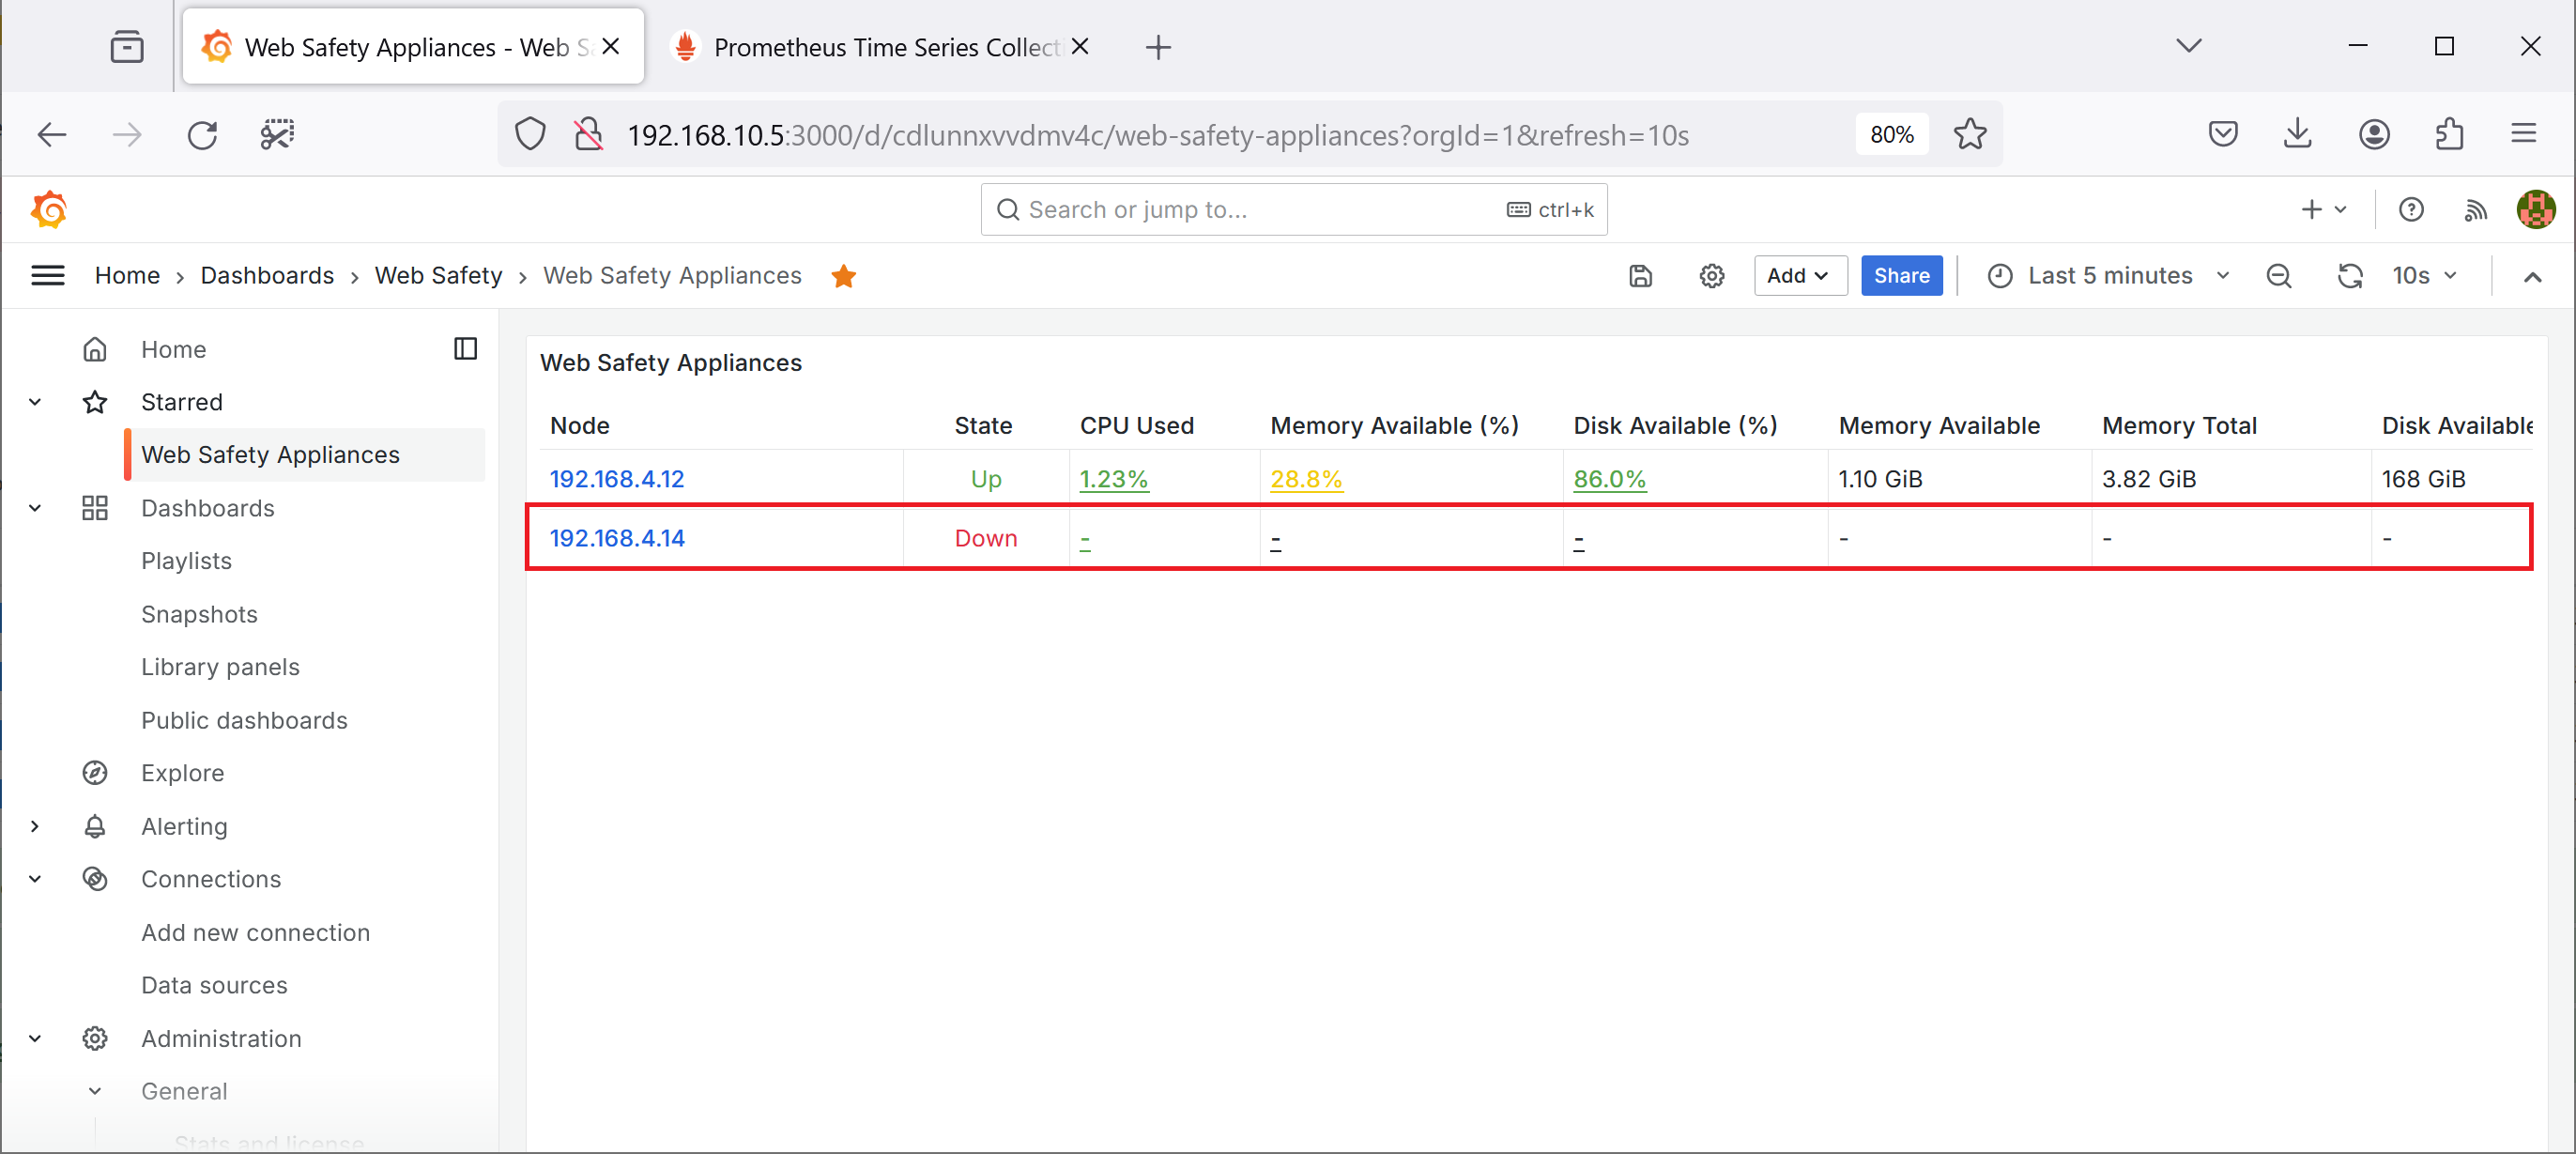
To verify alerts, we will now shutdown the 192.168.4.14 virtual appliance. Grafana will readily mark the appliance as Down as shown on the following screenshot.
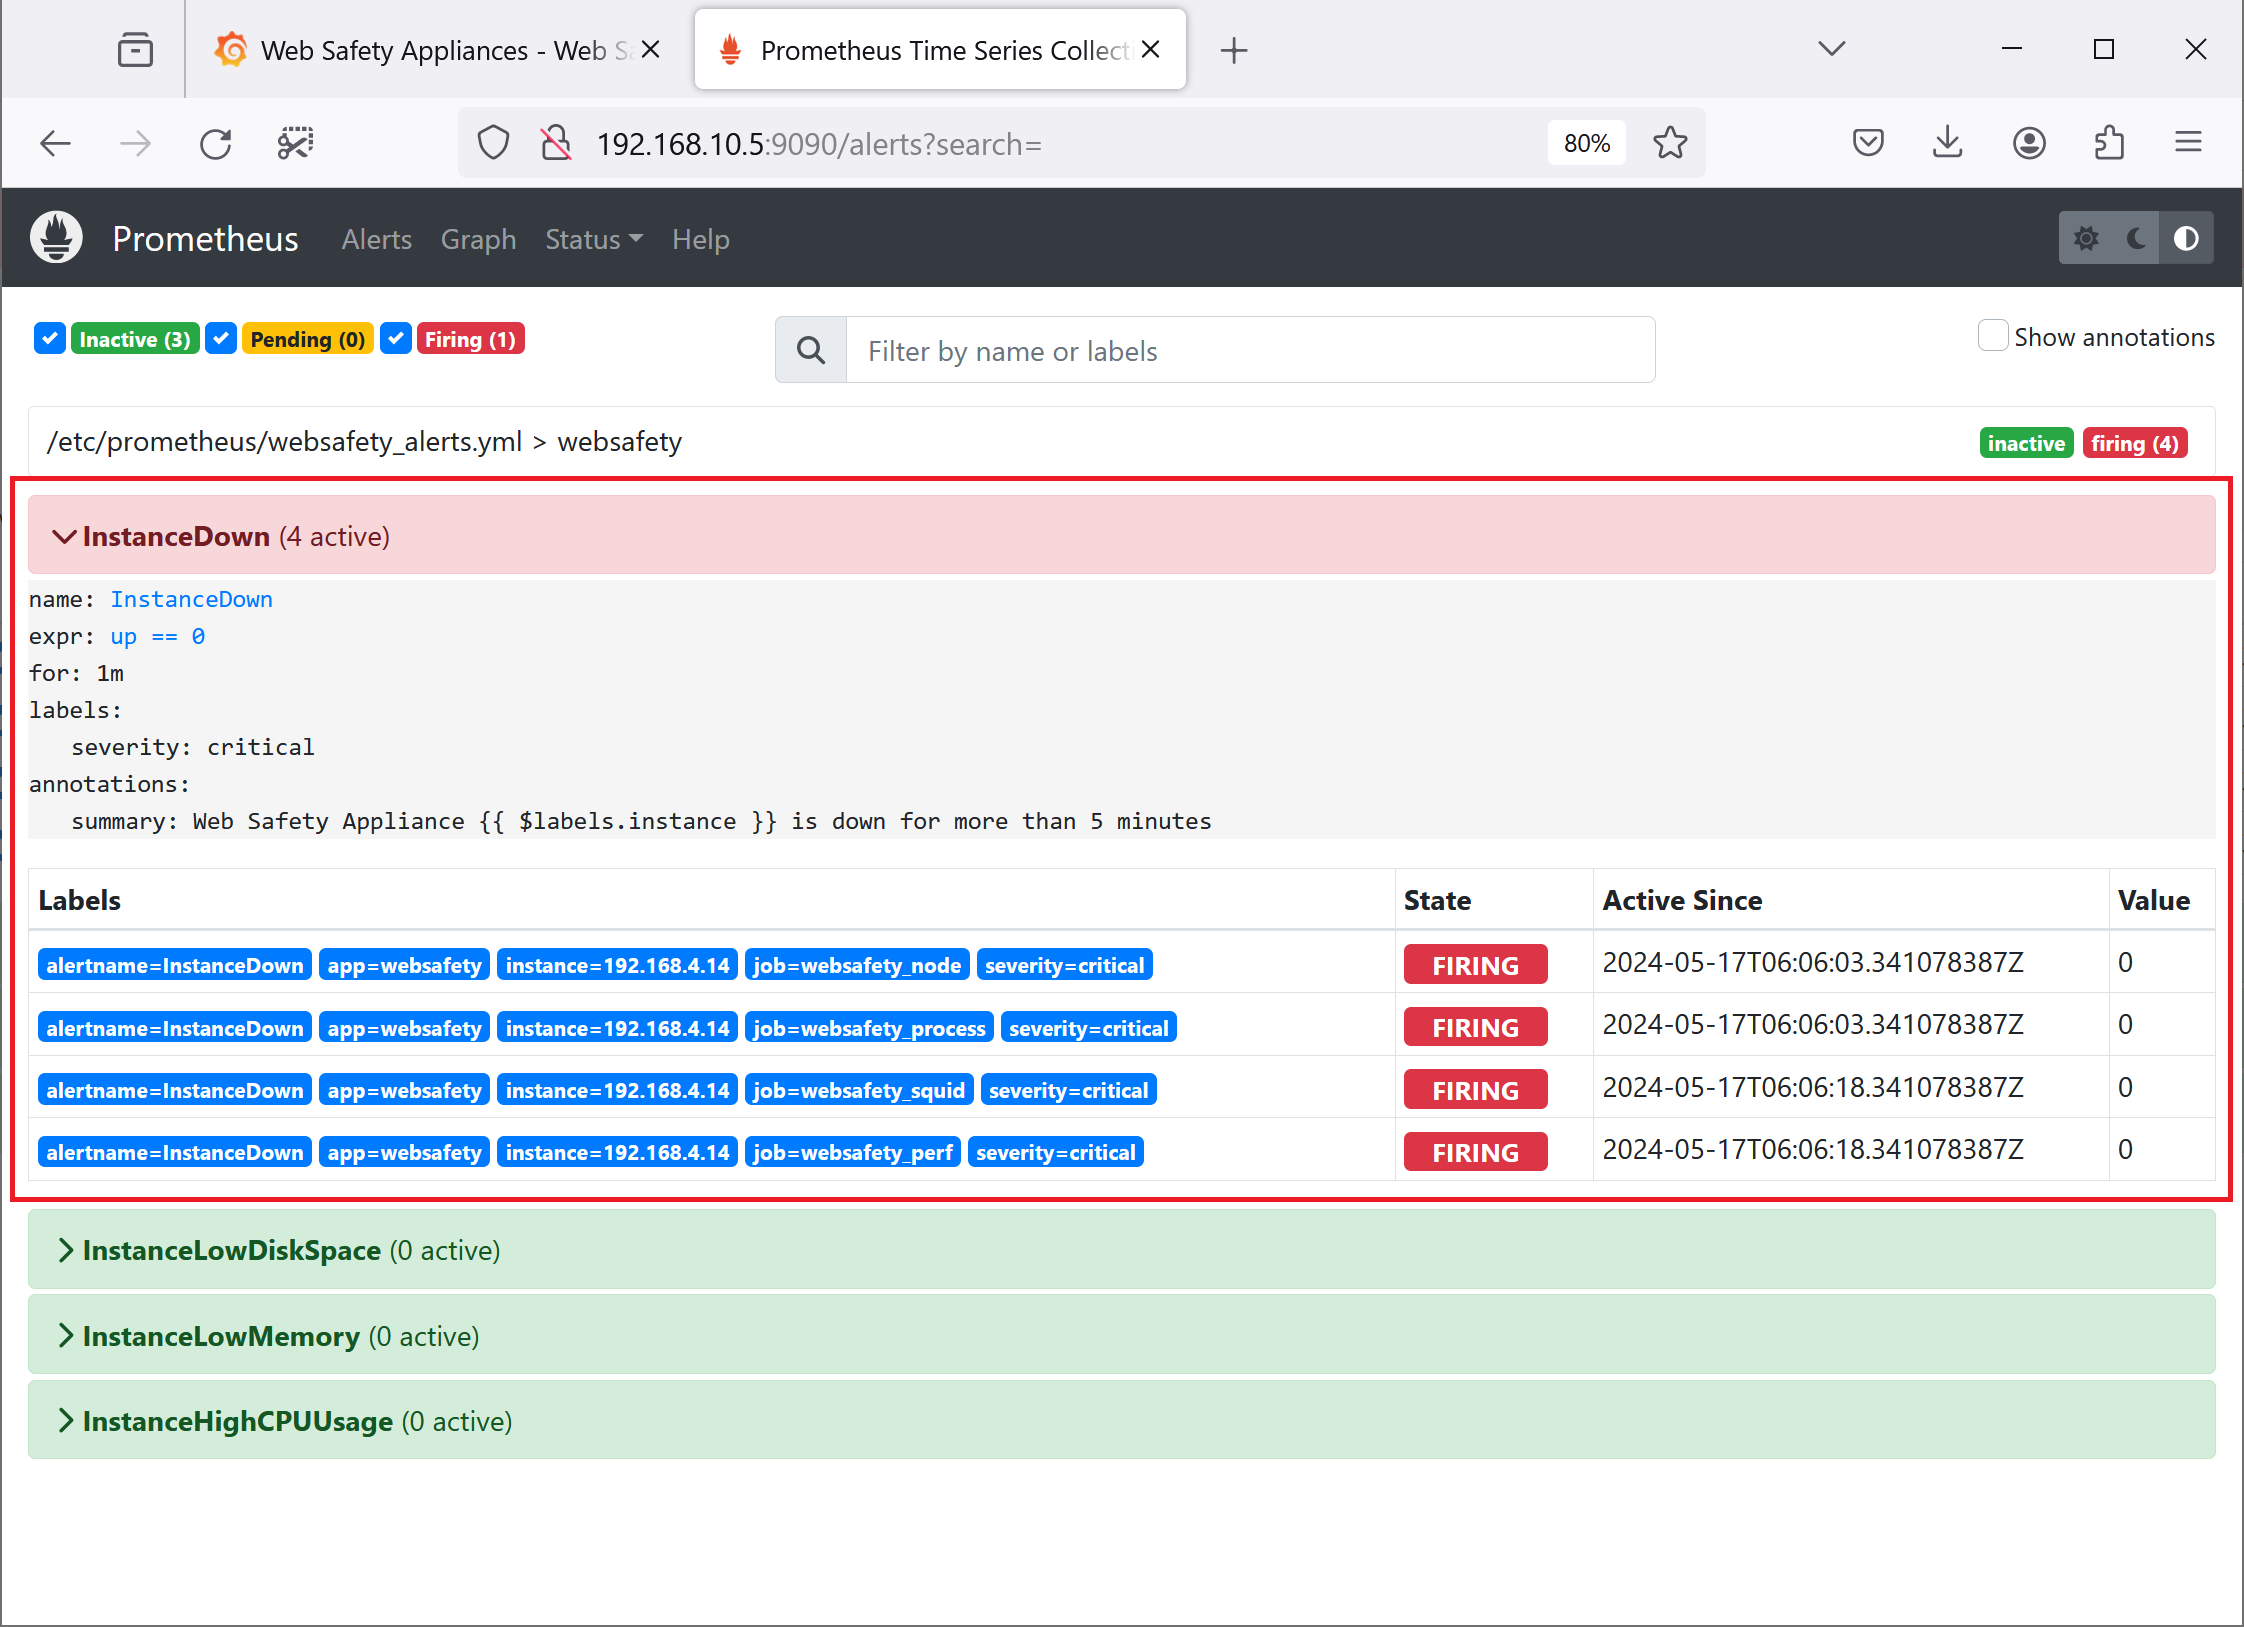
Alert will be visible and firing in Prometheus.
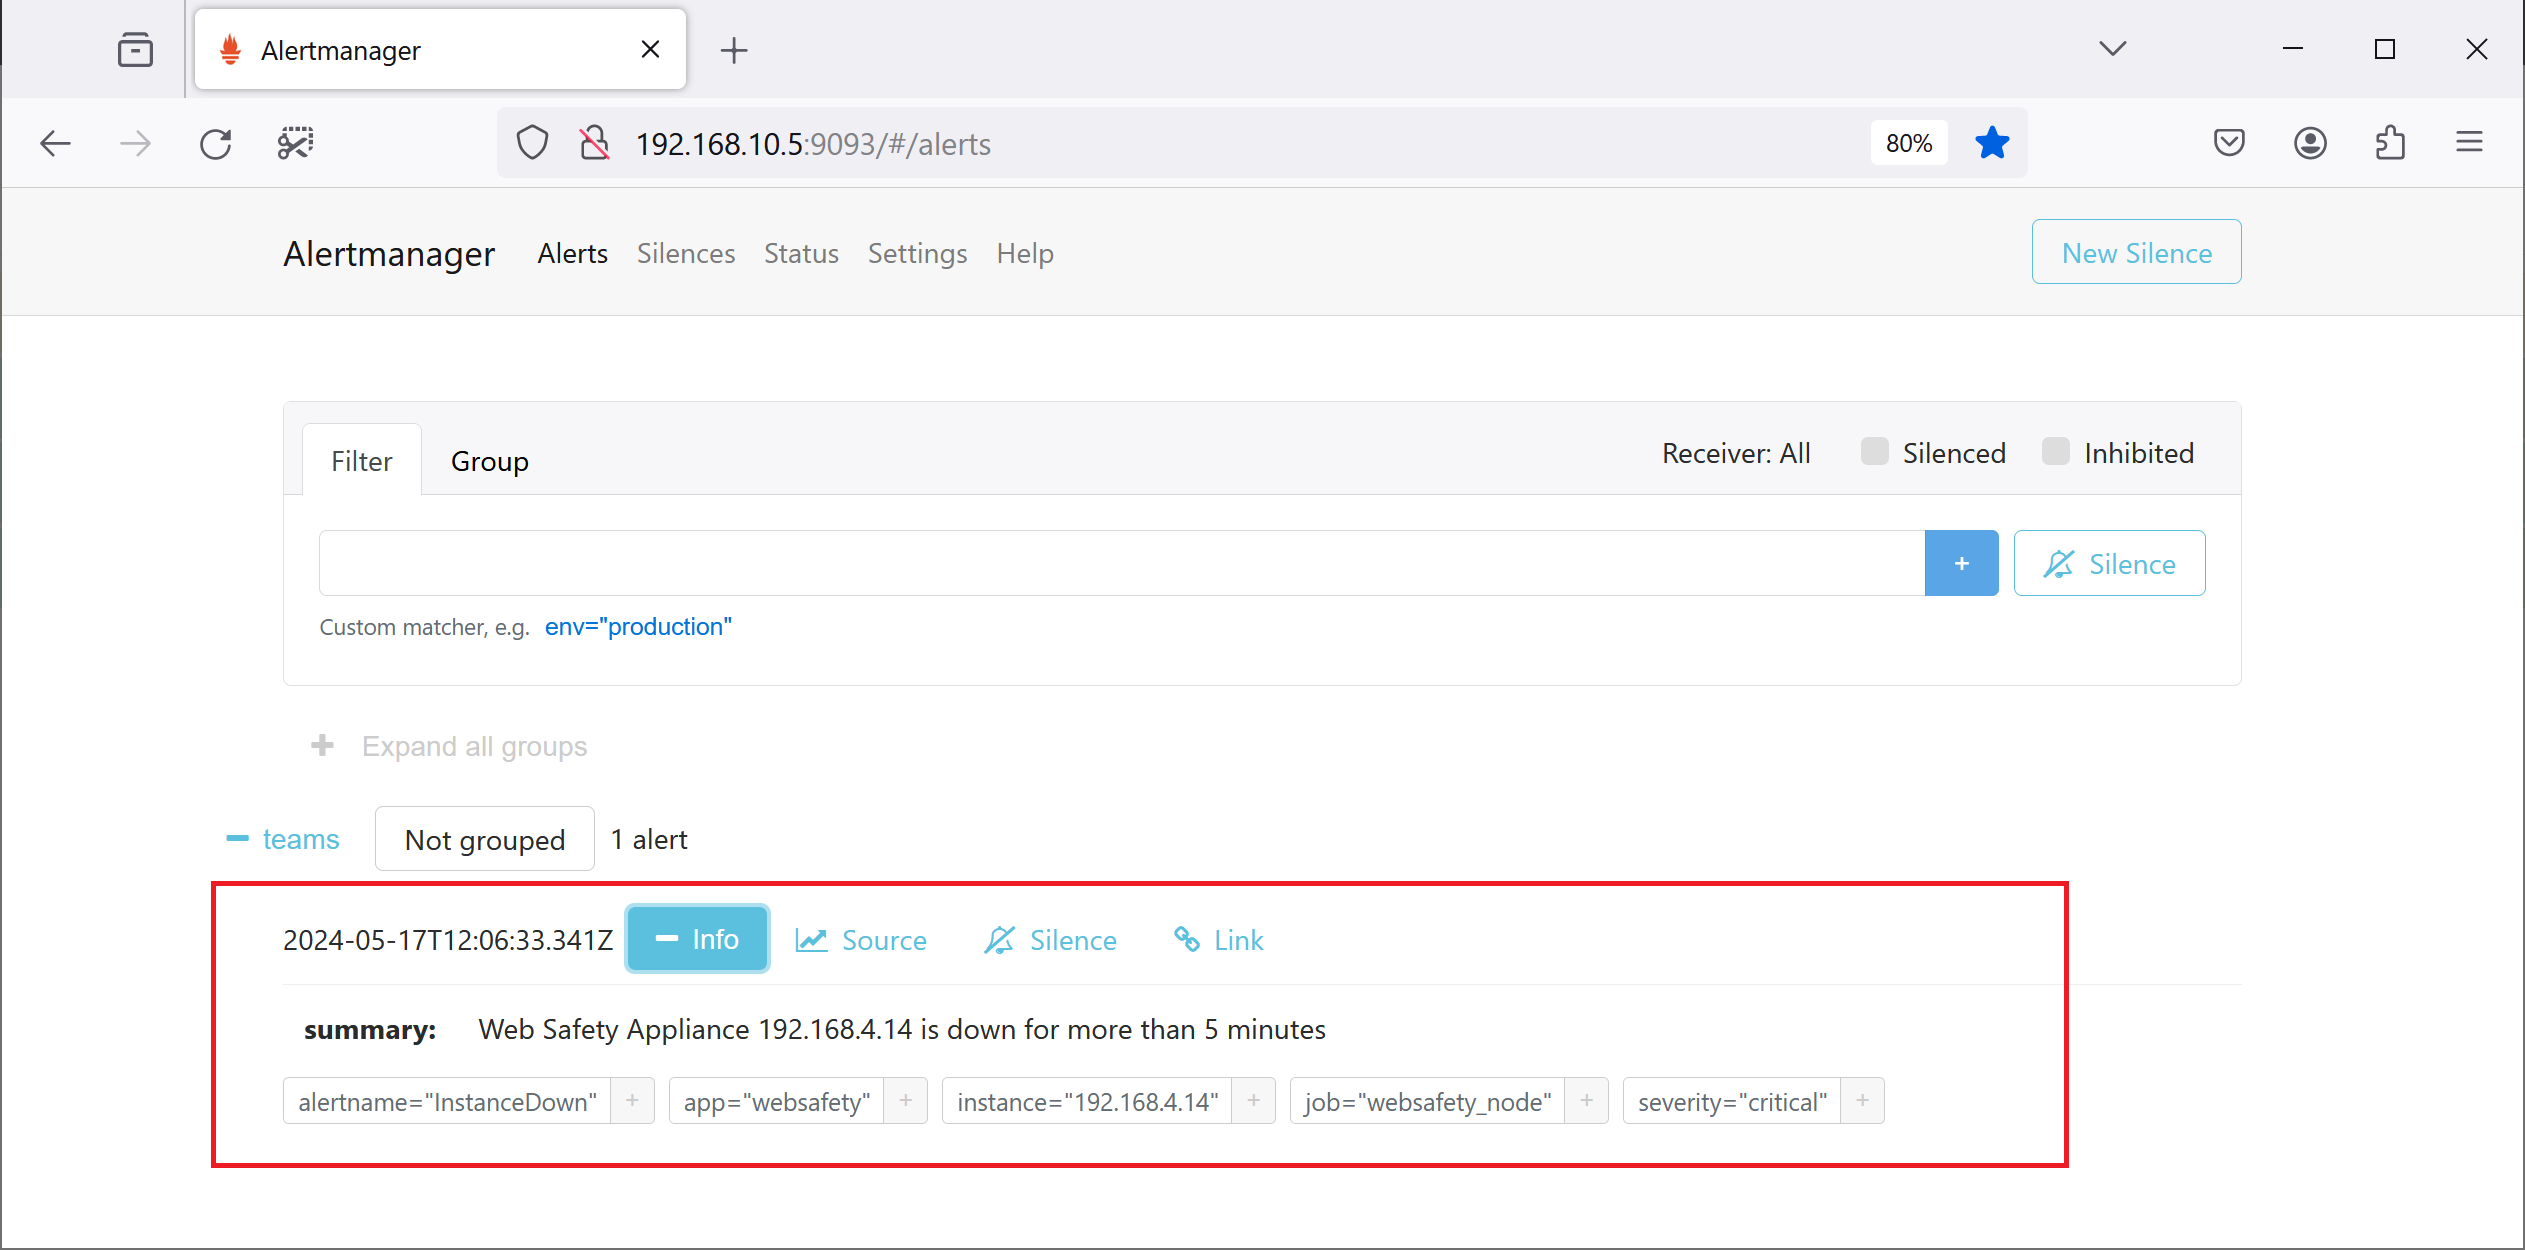
Admin UI of Alert Manager will also show the alert as firing.
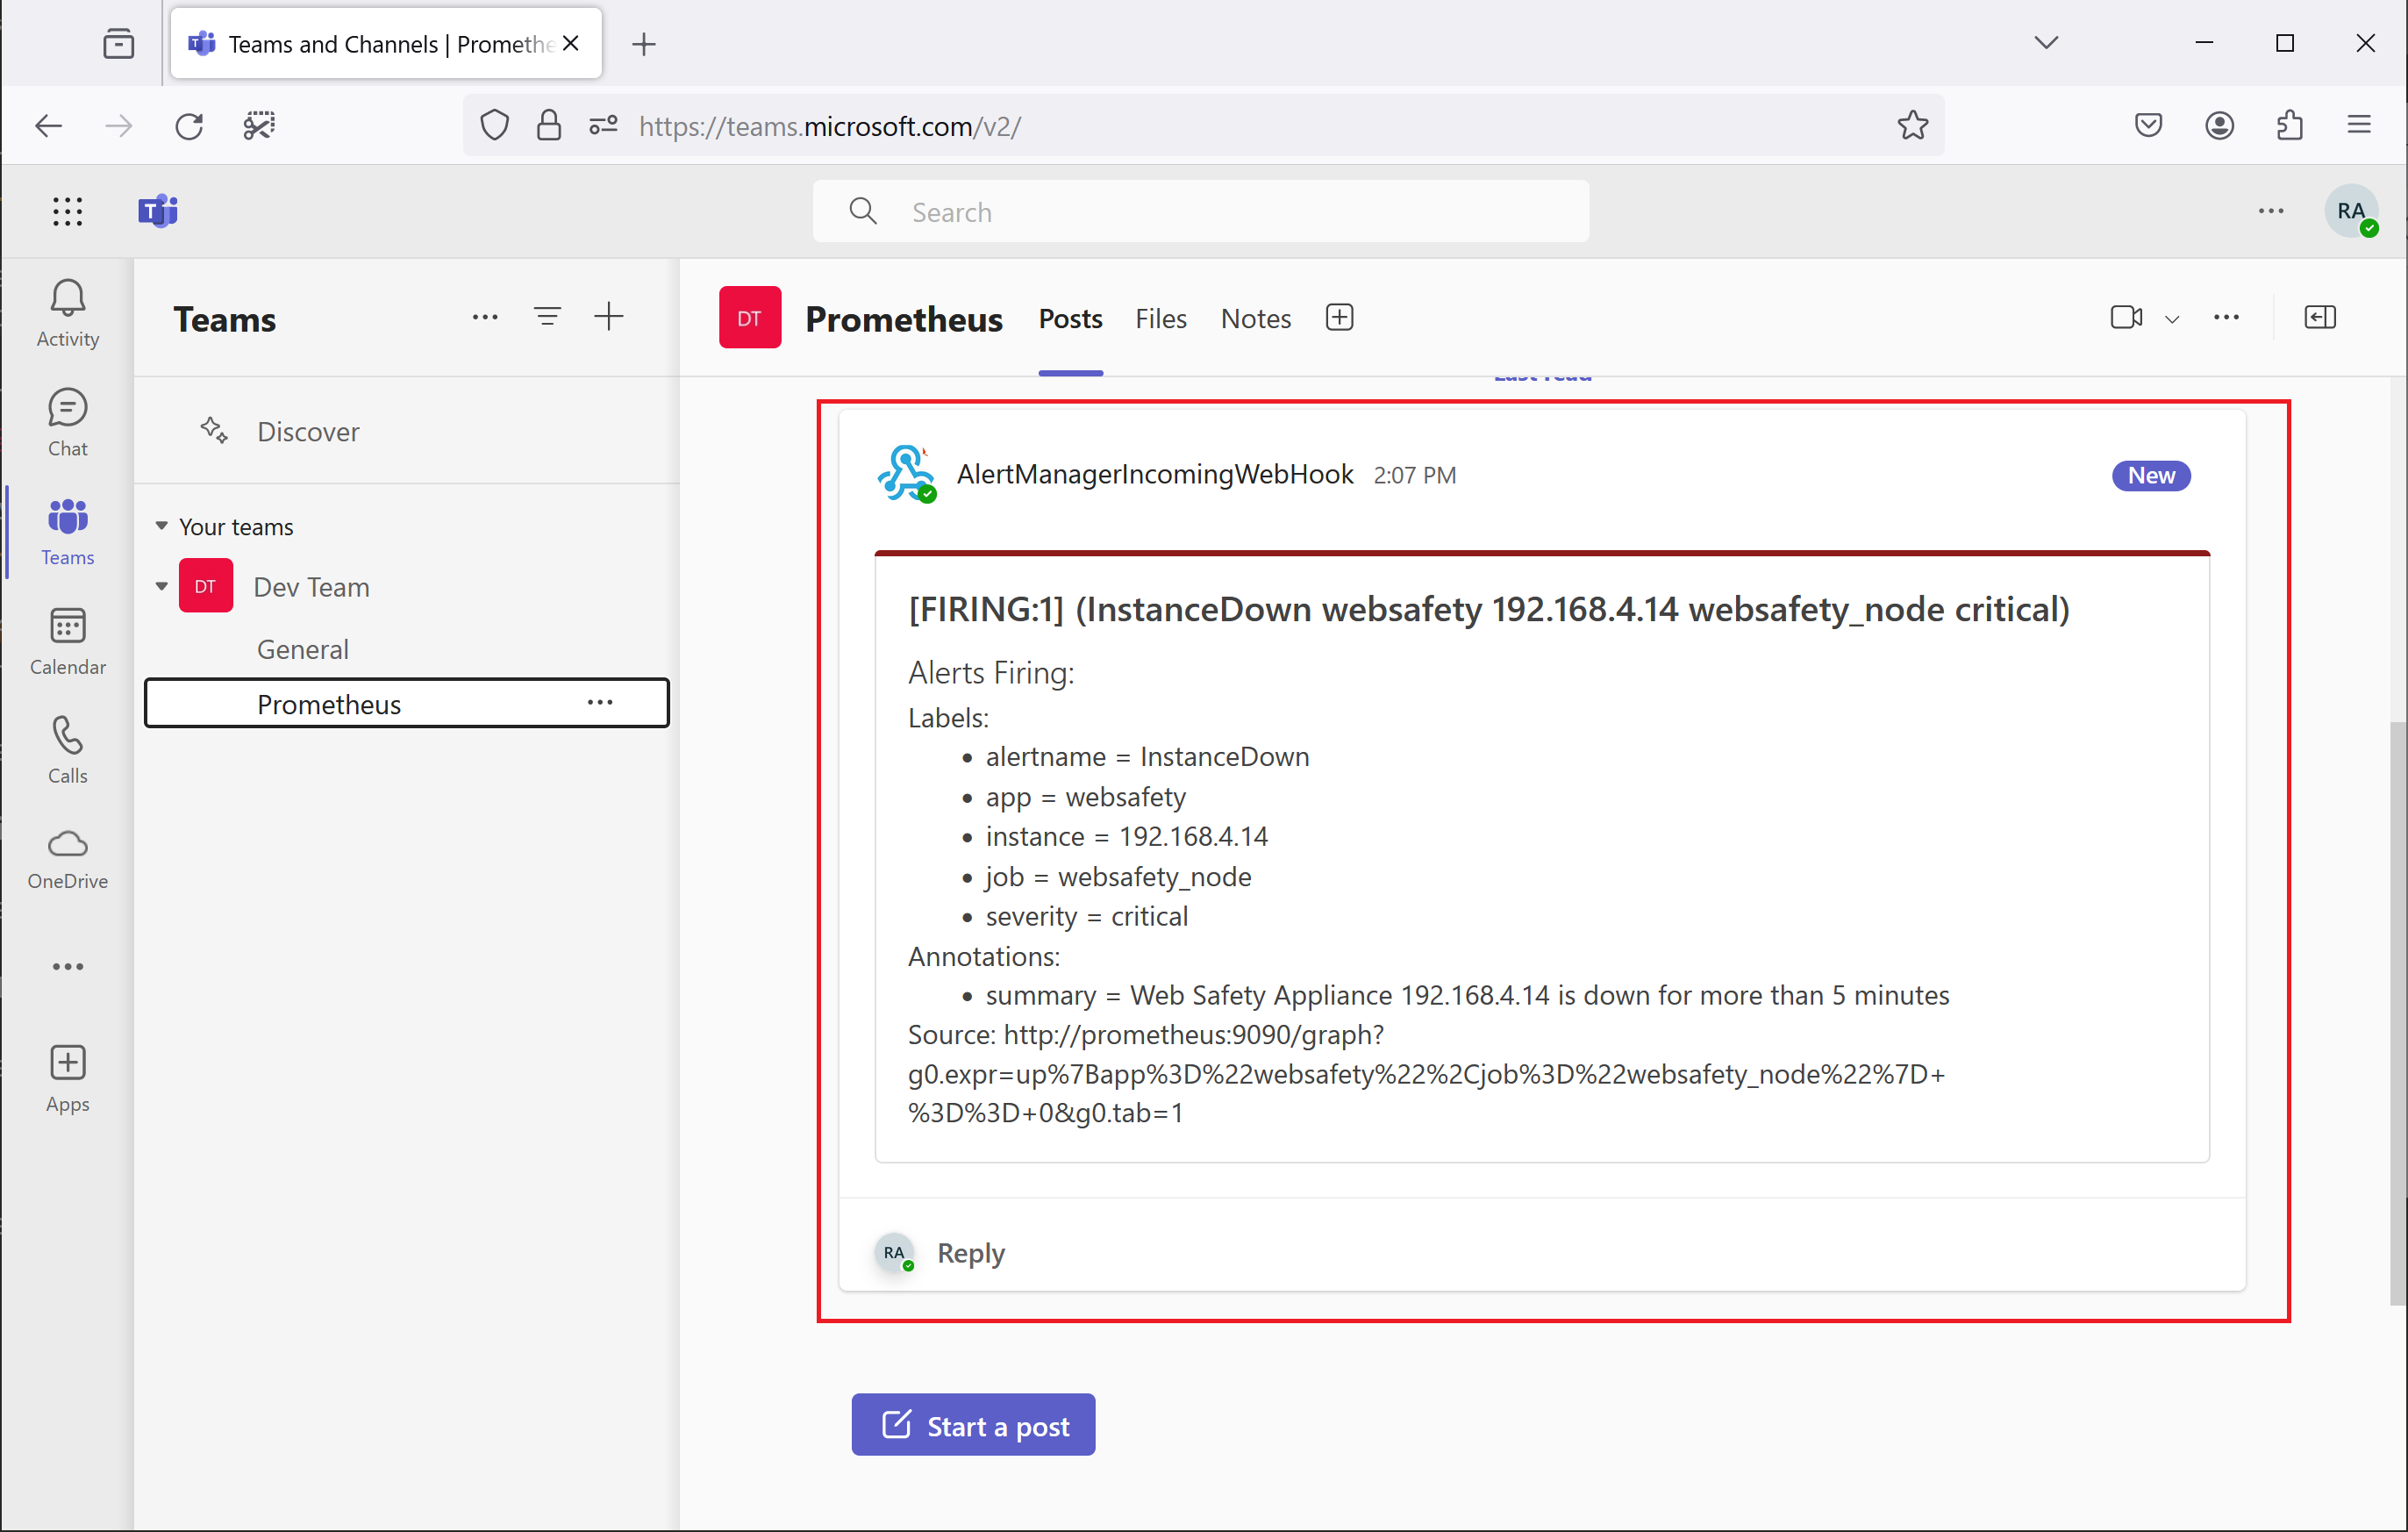
Finally our Prometheus channel at MS Teams will show an incoming alert.