Grafana Dashboards for Web Safety
In order to visualize the state of the virtual appliances, we will need to import two dashboards into Grafana. First, navigate to Grafana / Dashboards and create a subfolder to keep the things organized. Name this subfolder Web Safety.
Click on subfolder name and select Import button on the right, then navigate to the https://github.com/diladele/websafety/tree/release-9.2/appliance/perf/server/dashboards folder (or just the unpacked zip folder with all the scripts) and import the following dashboard JSON files.
Web Safety Appliances
Web Safety Appliance Overview
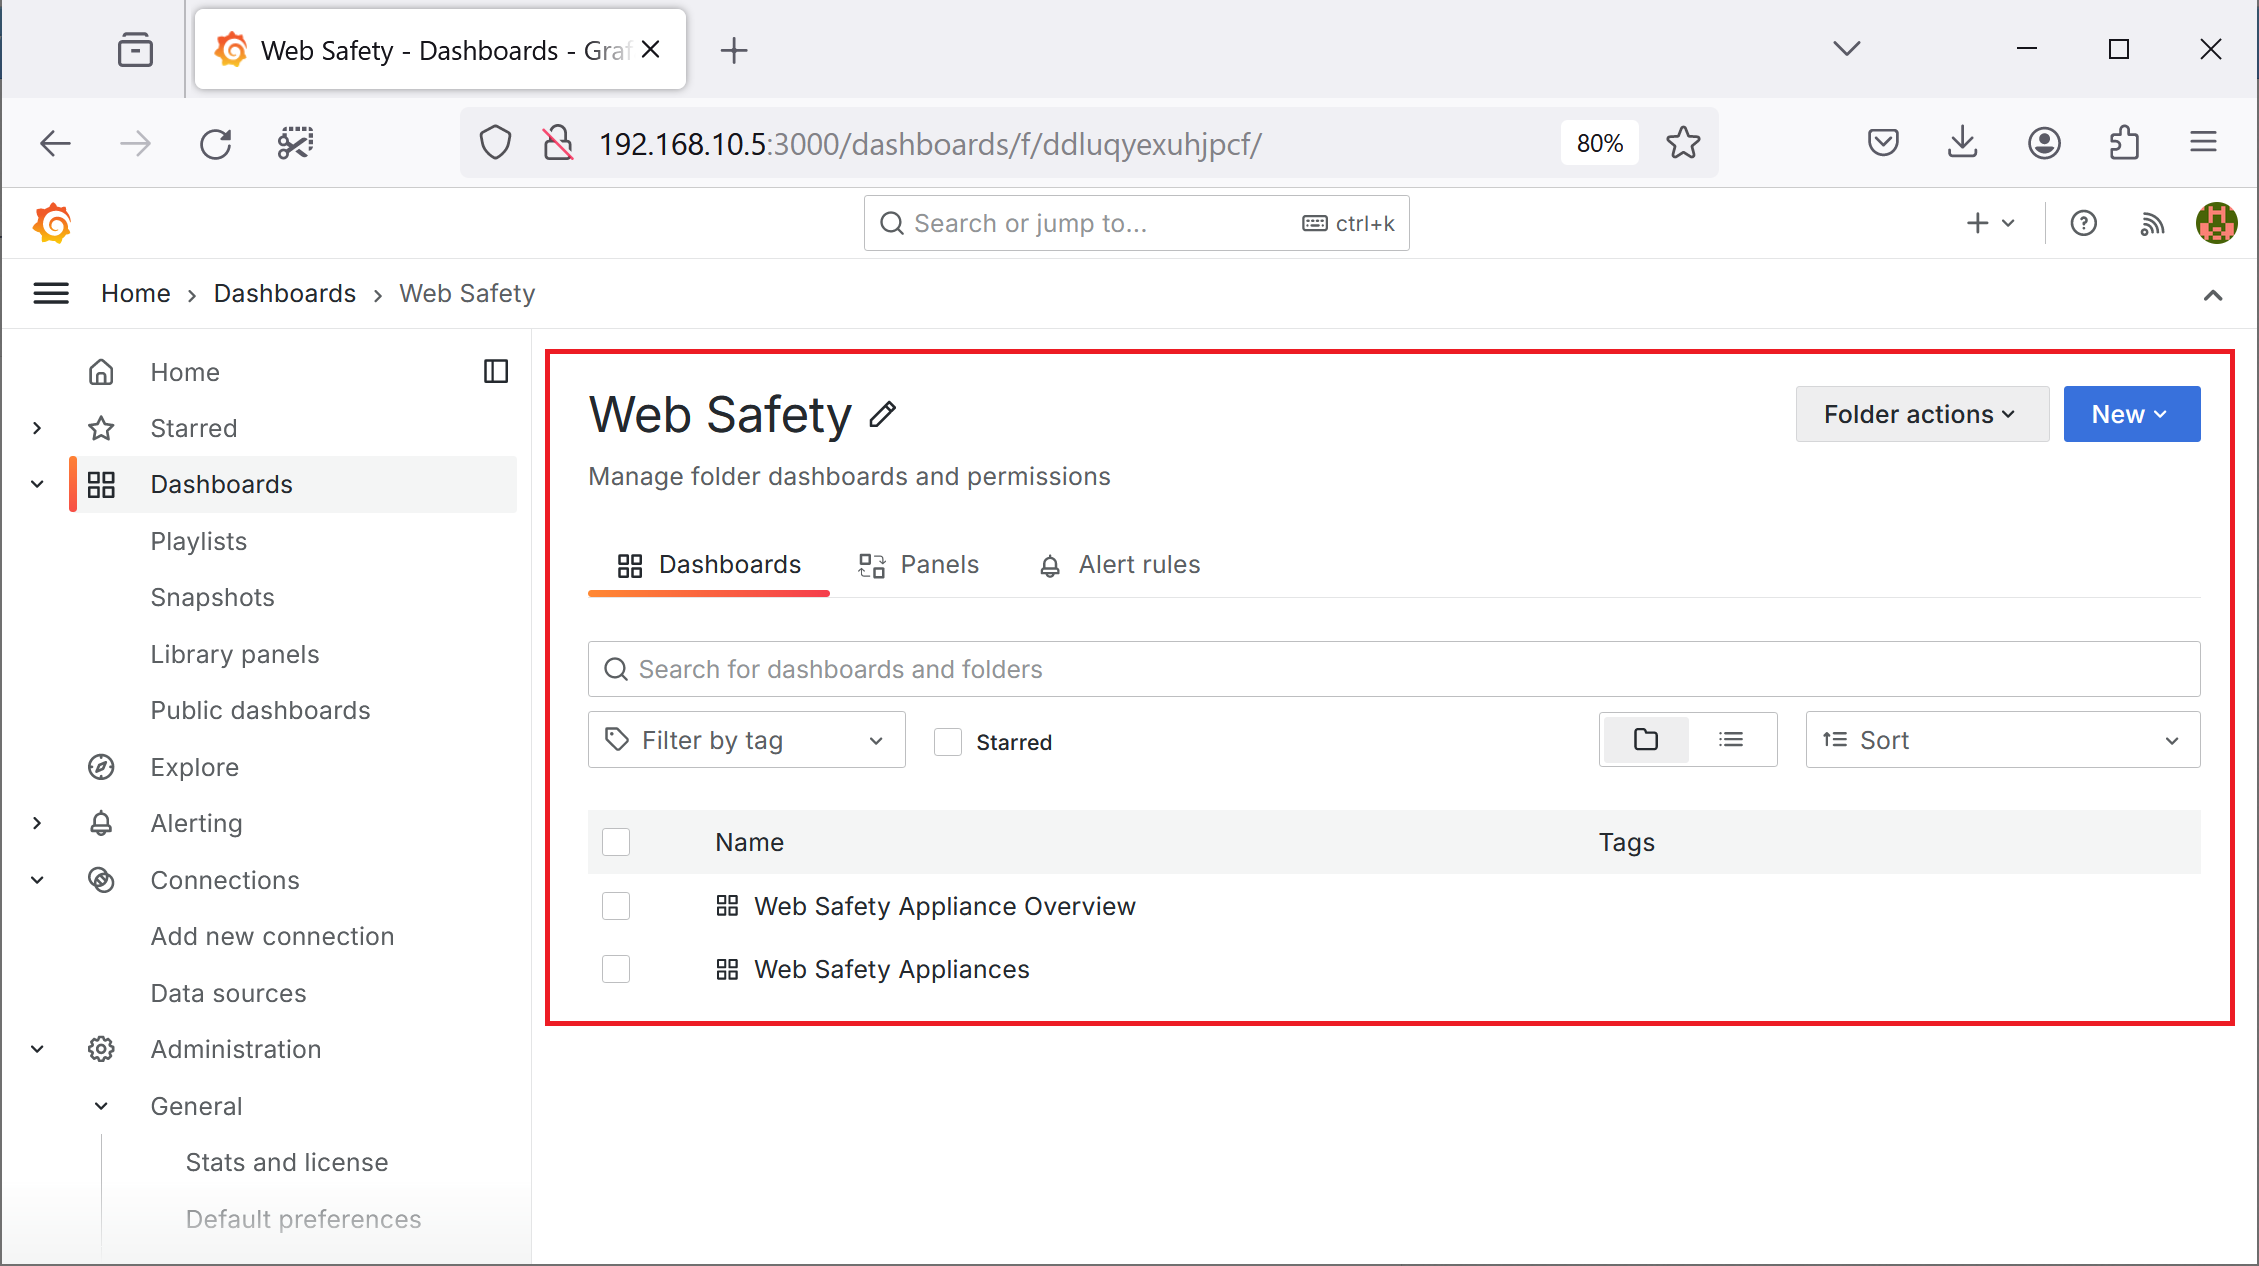
The subfolder should now look like the following.

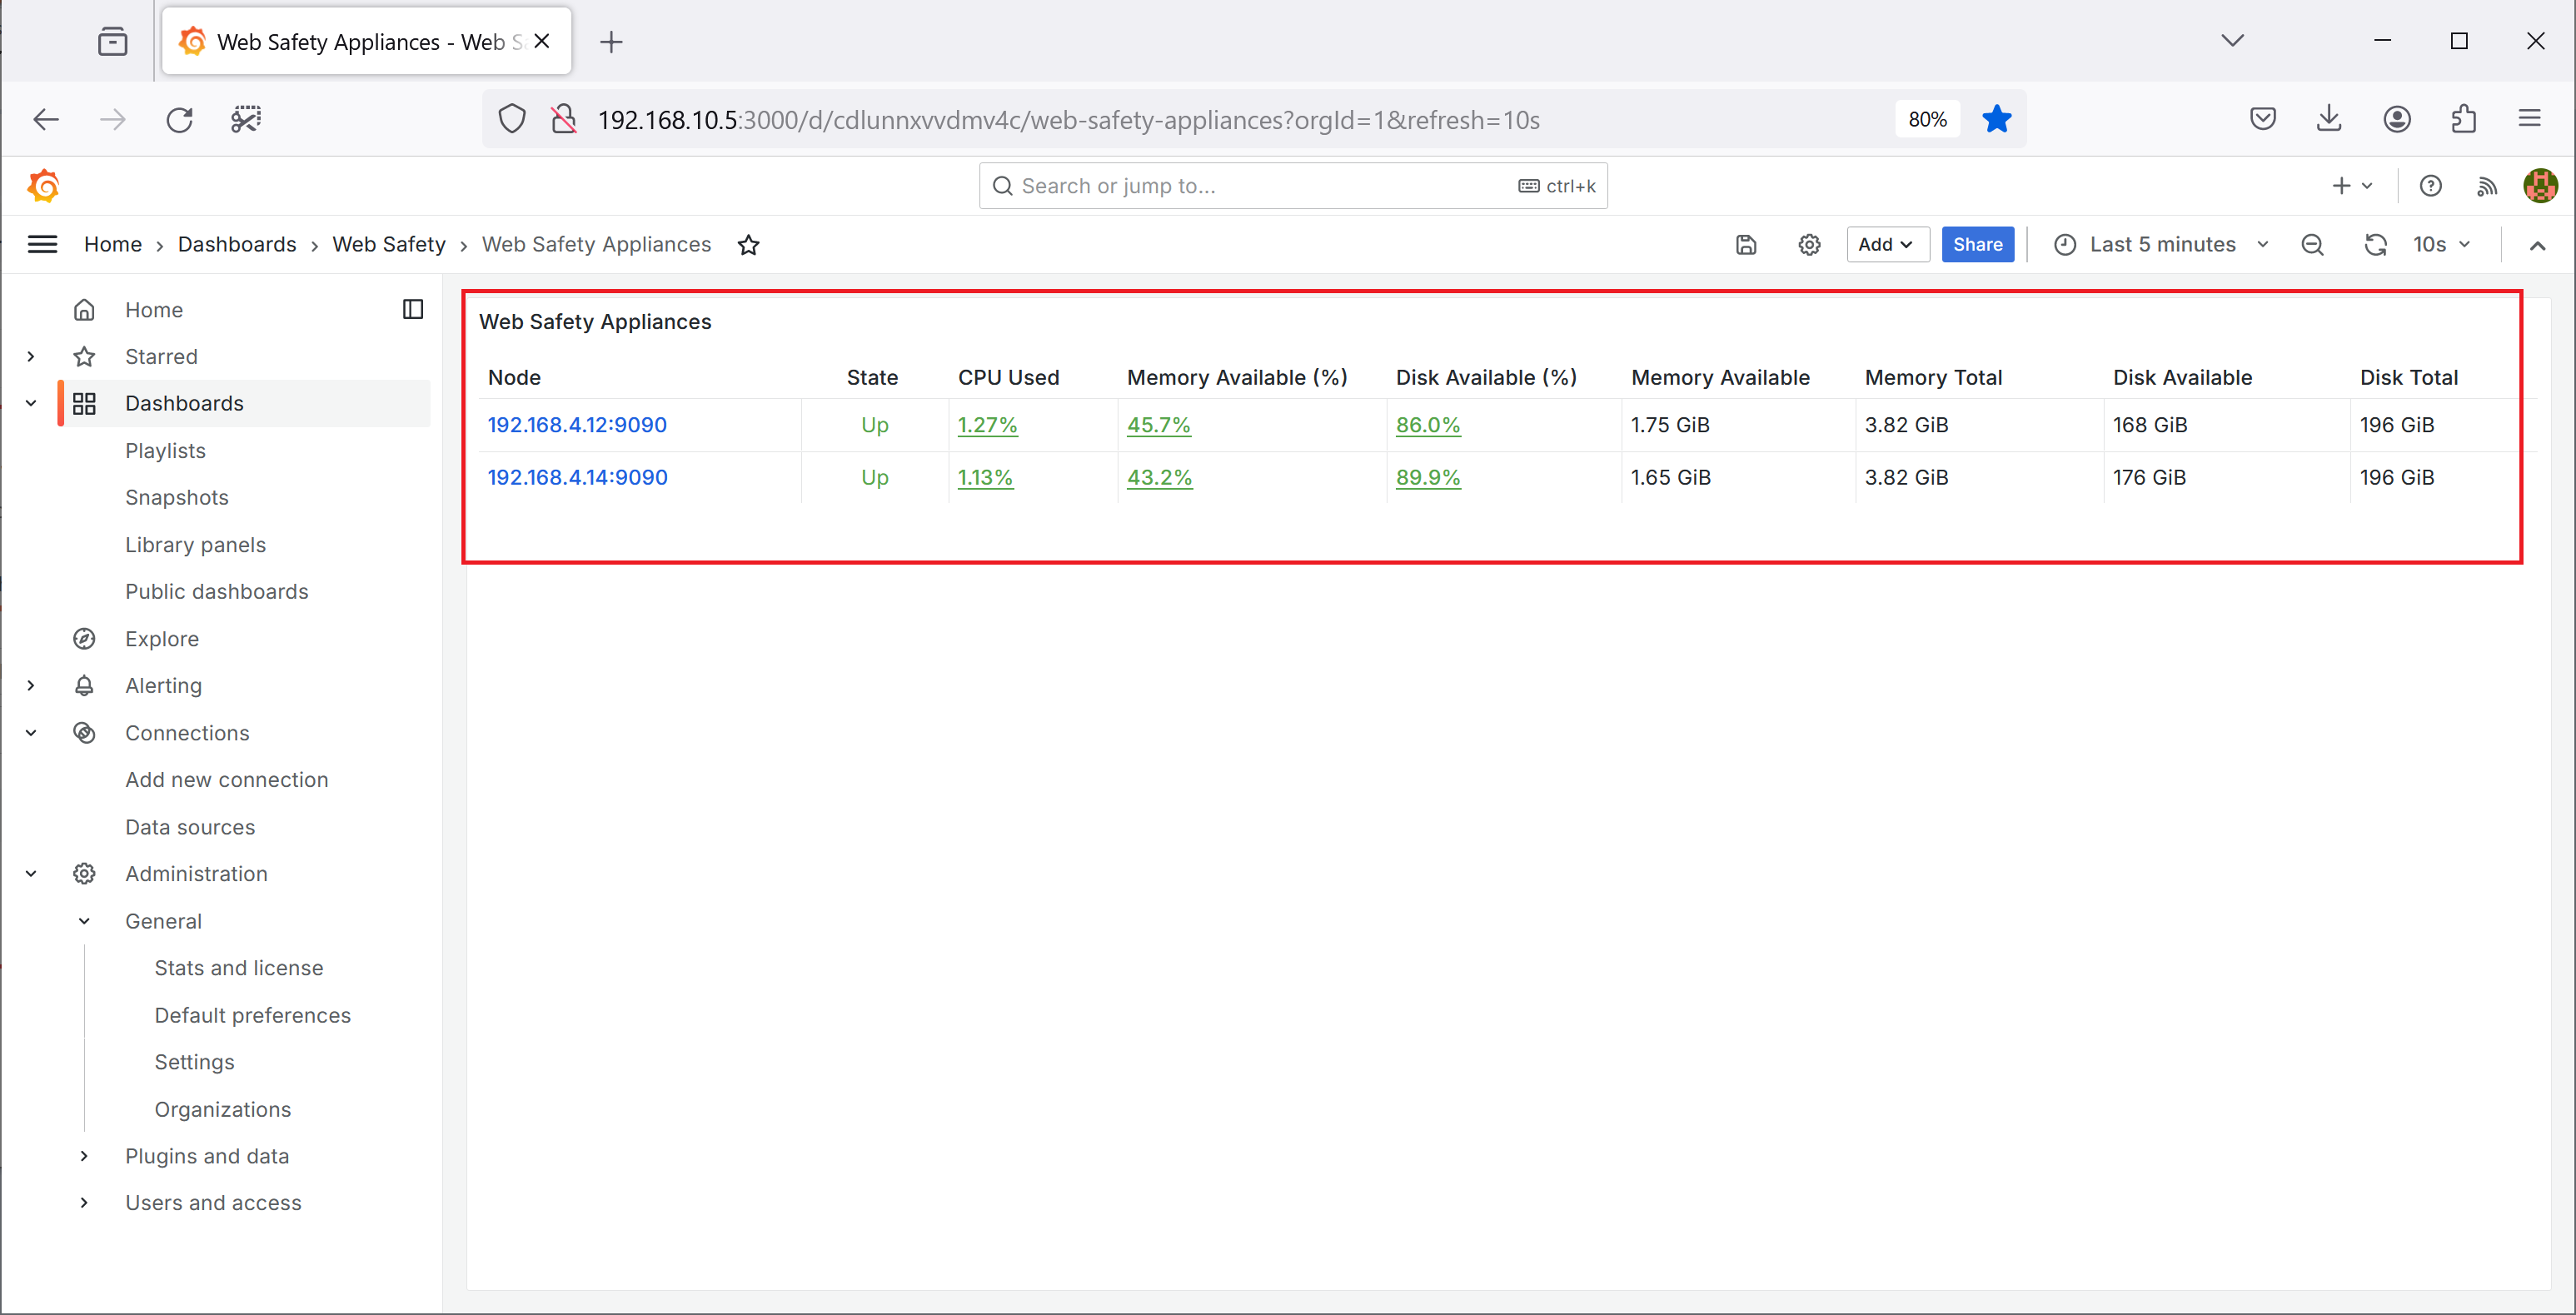
The Web Safety Appliances overview dashboard will list all instances of Web Safety appliances deployed together with some key metrics for each appliance as shown on the following screenshot.

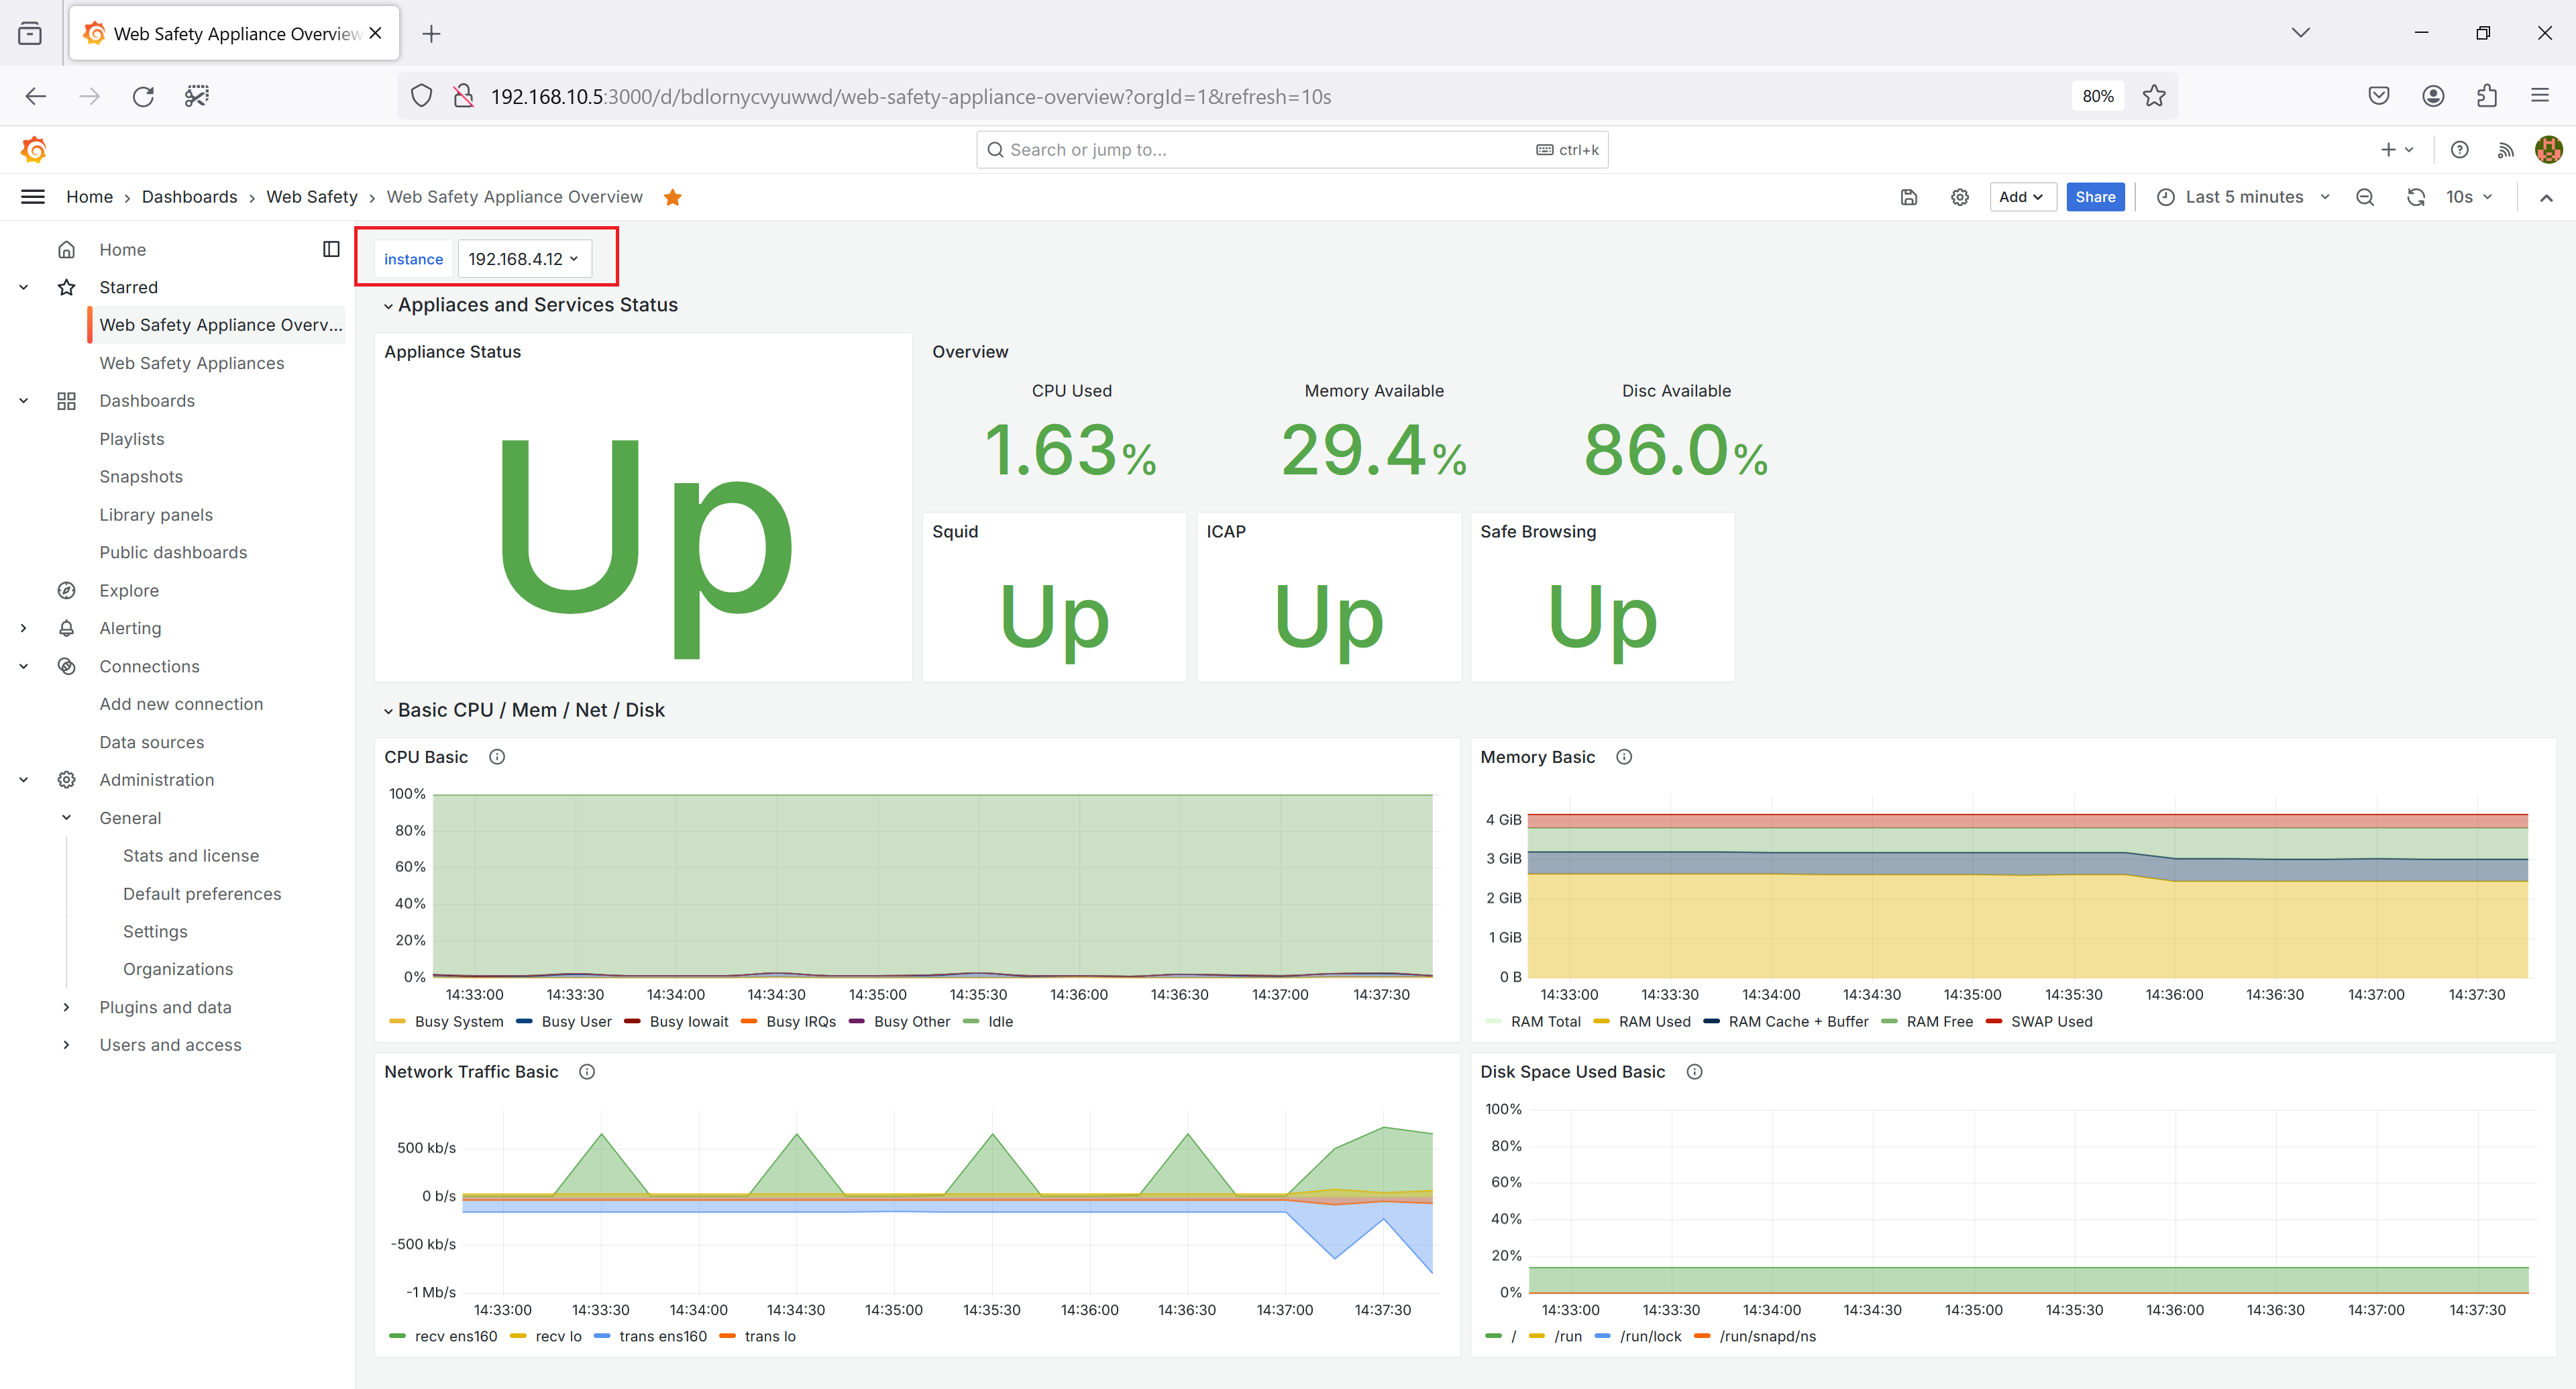
The second dashboard shows major metrics of a given Web Safety appliance. You can change which instance of the appliance to use at the top of the dashboard. The same dashboard is also linked from the Web Safety Appliances dashboard.
