Integrate Prometheus and Grafana
We now need to integrate the metrics collected by Prometheus with Grafana by creating a datasource and building a dashboard based on data collected from that datasource.
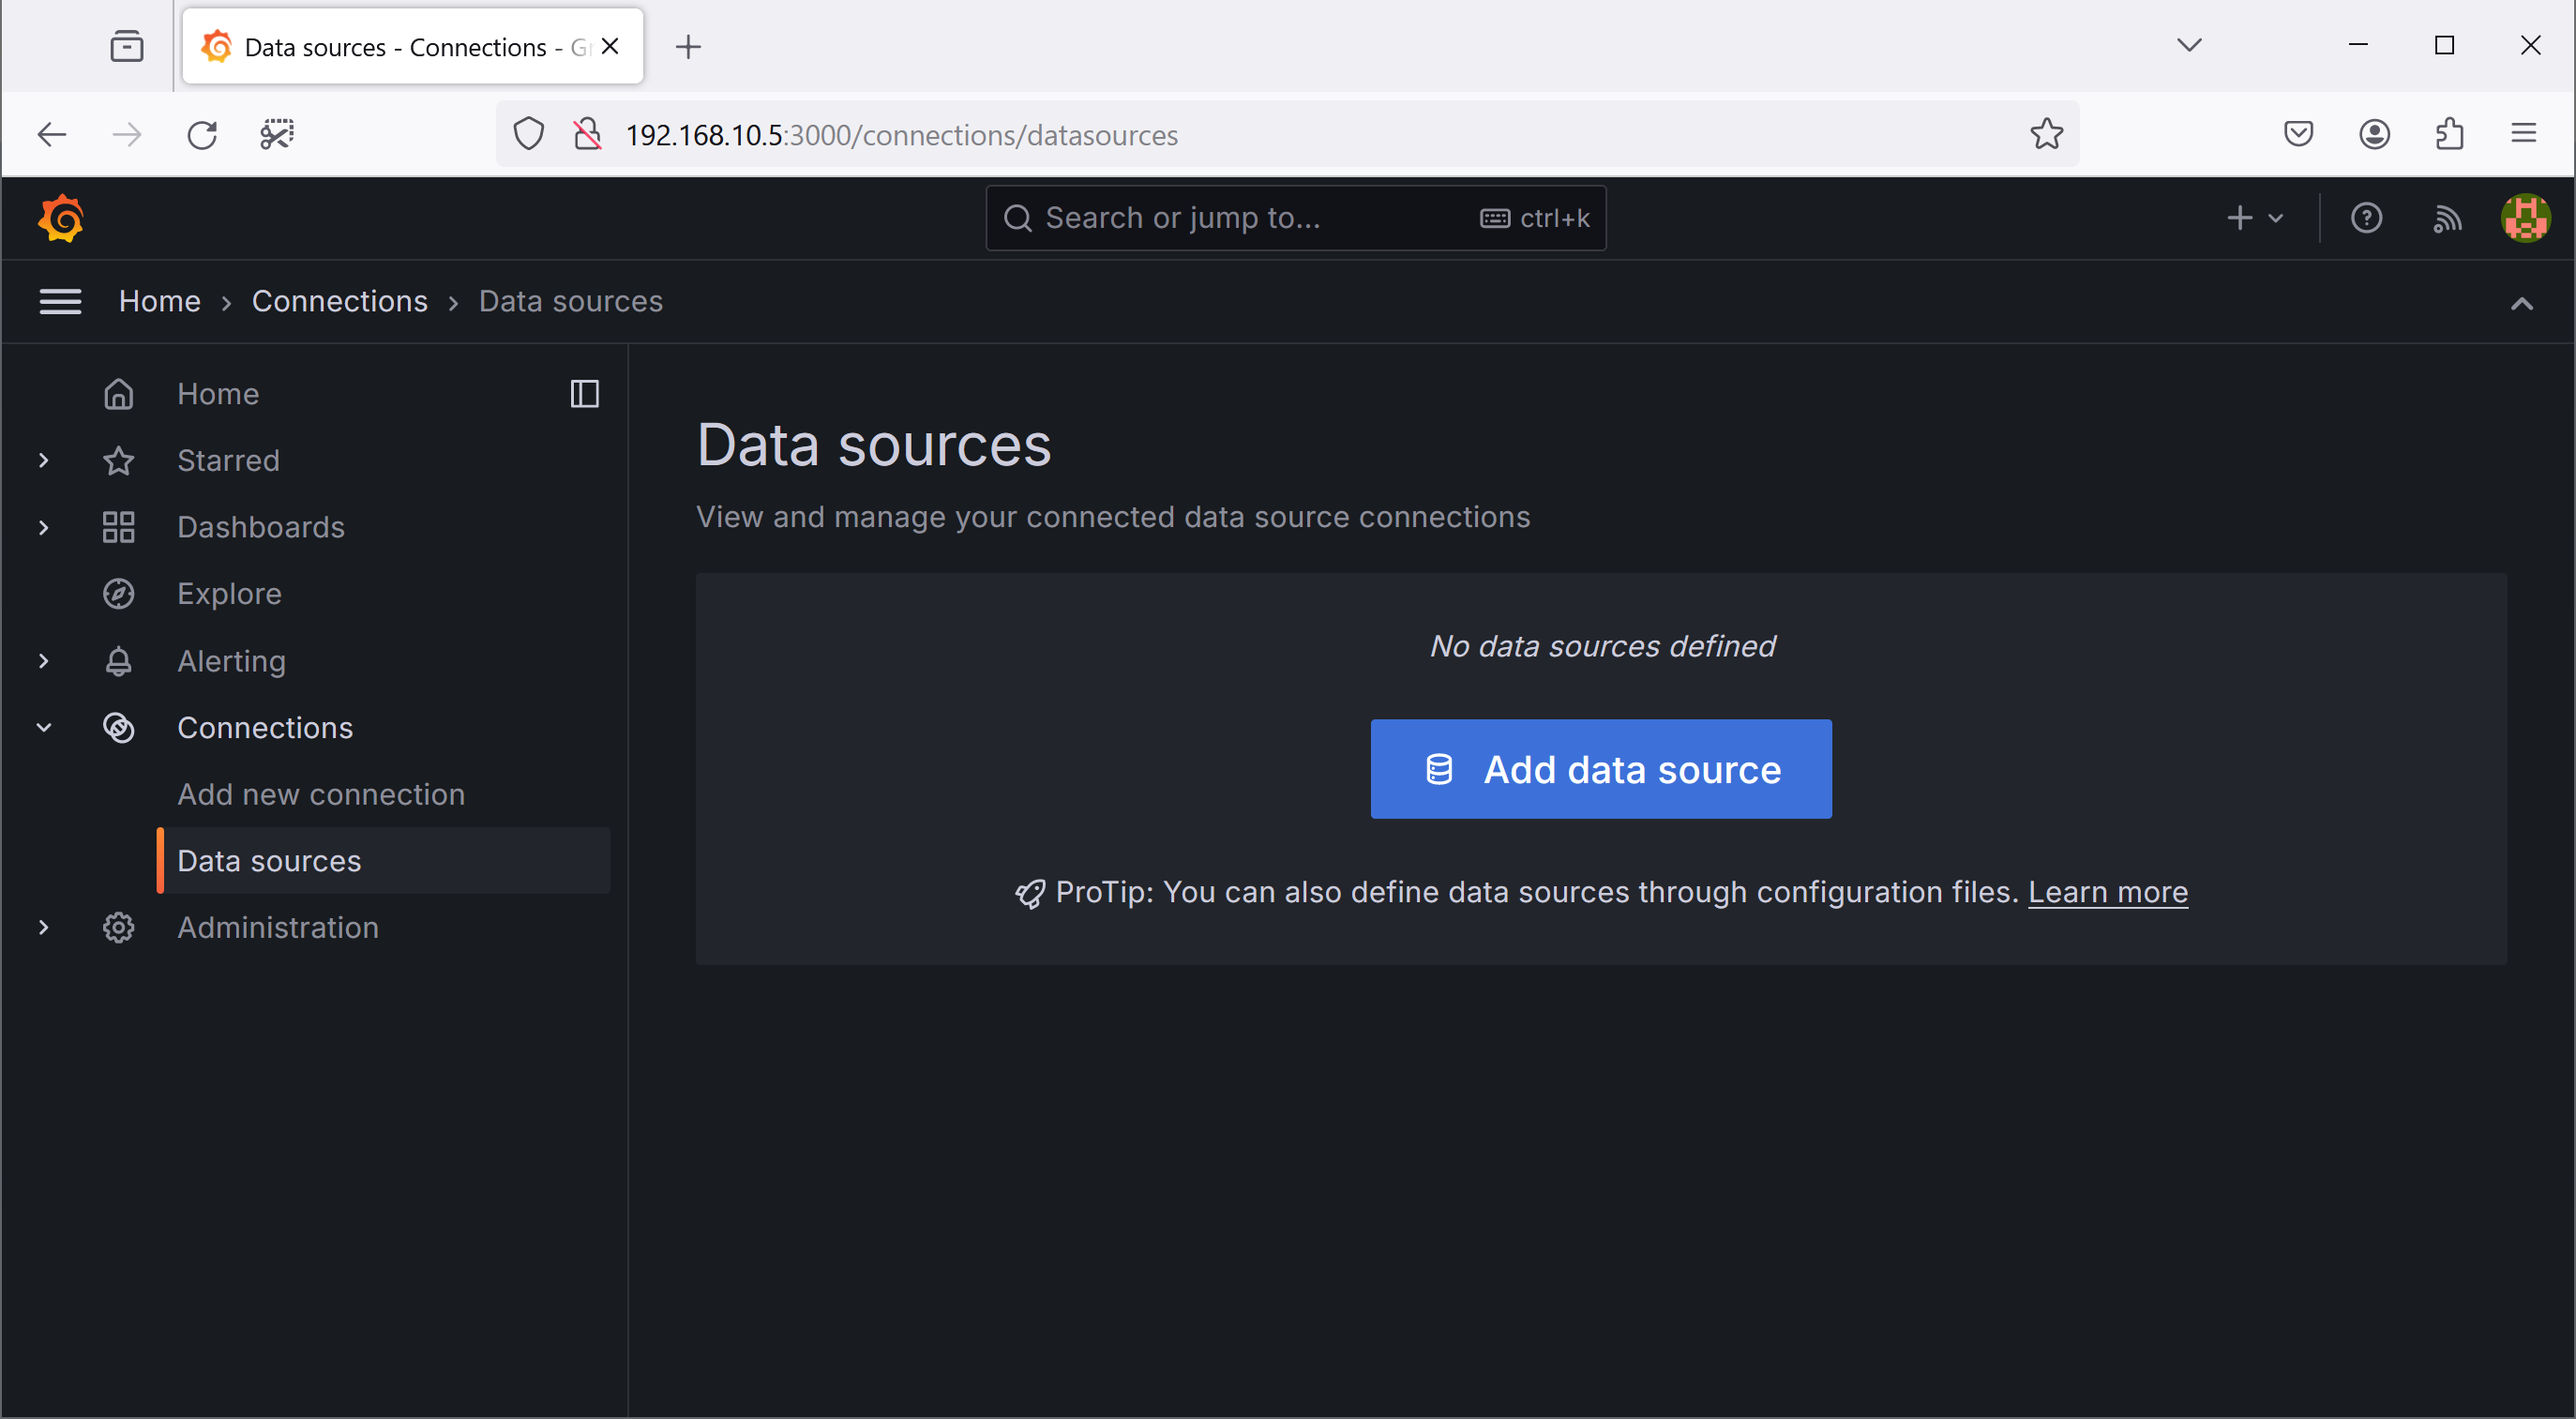
Select Connections / Datasources as shown on the following screenshot, then click the Add Datasource button and choose Prometheus.
Use http://localhost:9090 as Prometheus server URL parameter.
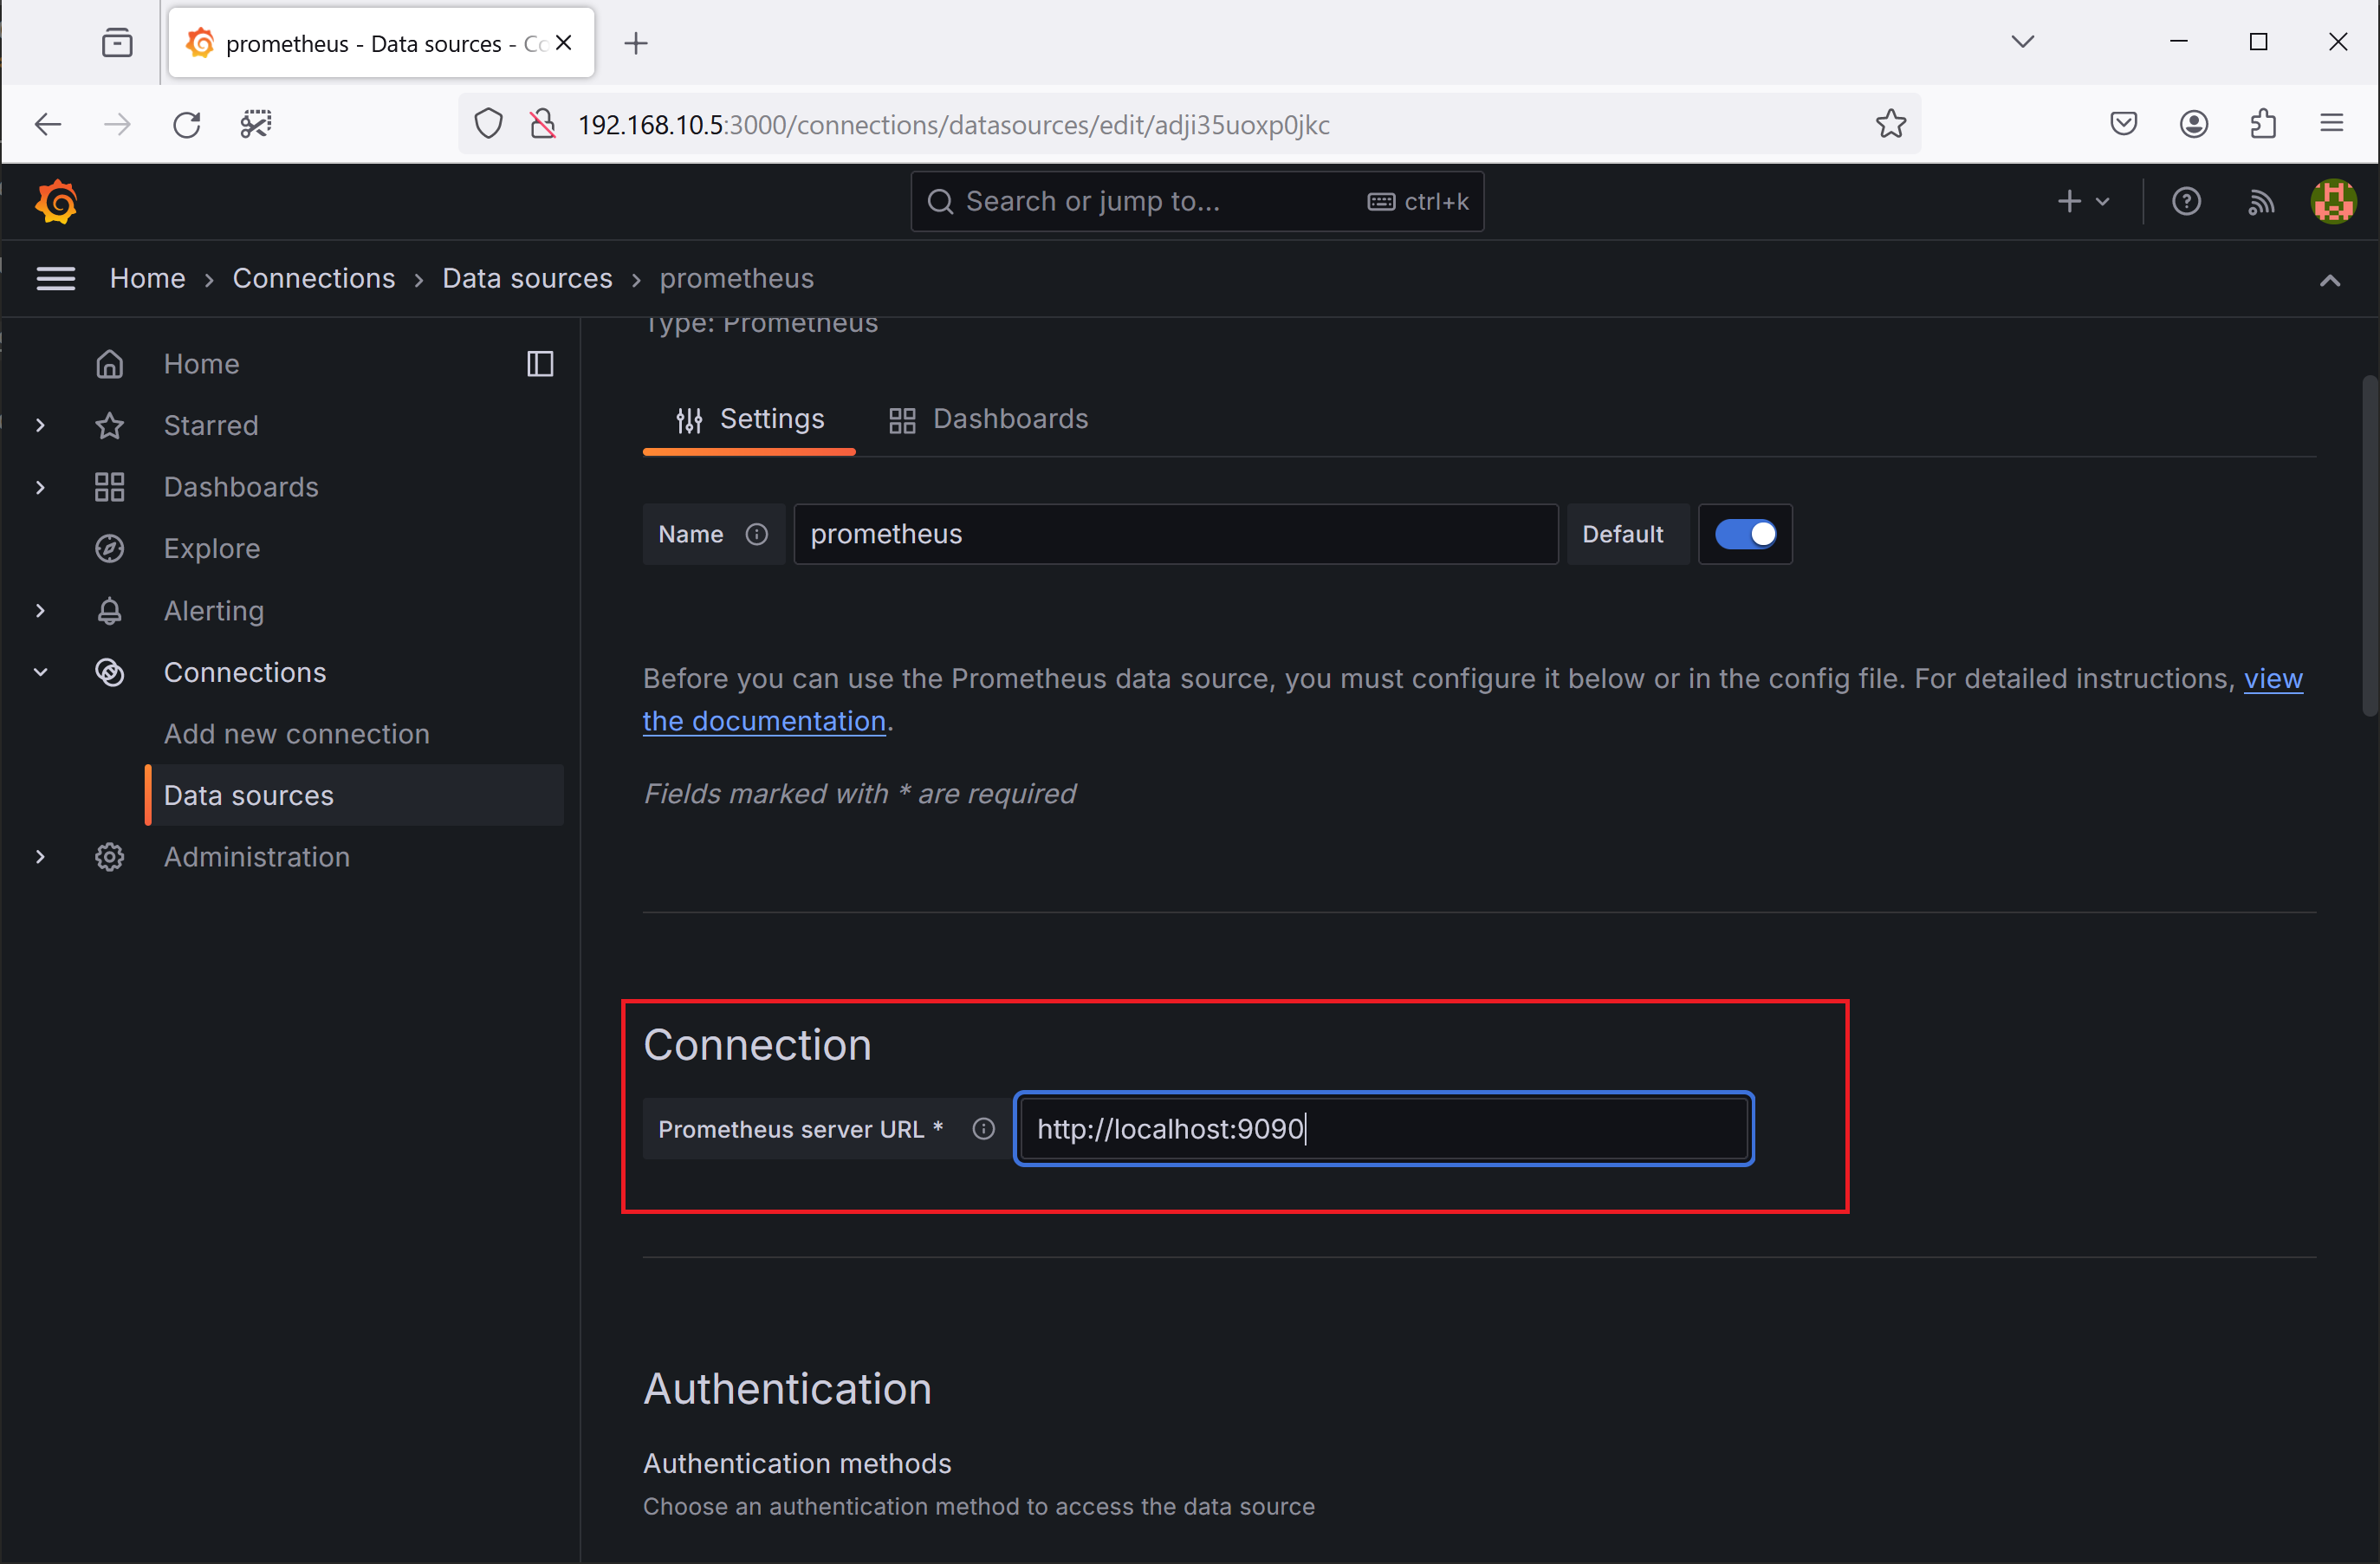
Scroll to the end of the page and click Save and Test. Test should complete successfully with the Successfully queried the Prometheus API message. Our Prometheus and Grafana are now ready to accept metrics from Web Safety appliances.