Appliance Exporters
In this tutorial we will plan to monitor two different Web Safety appliances, with IP addresses 192.168.4.12 and 192.168.4.14 respectively. These machines are part of our testing cluster in Web Safety acceptance test lab.
We will need to install and configure appliance exporters on each Web Safety appliance. An appliance exporter is a (collection) or Prometheus exporters which gather metrics about processes running on virtual appliance and expose those metrics to our monitoring server.
Currently, default Web Safety appliance does not have the required exporters installed, so we will need to manually download and run the scripts from our GitHub repository. These scripts will install the following exporters.
Exporter |
Description |
|---|---|
Node Exporter |
exports statistics about Operating System |
Squid Exporter |
exports statistics about Squid Proxy |
Perf Exporter |
exports statistics about ICAP and Safe Browsing |
Process Exporter |
exports statistics about running processes |
The following steps describe each script in detail.
Update the Machine
First, run the 01_update.sh script as root user to update the underlying operating system of the appliance.
#!/bin/bash

# update should be done as root
if [[ $EUID -ne 0 ]]; then
   echo "This script must be run as root" 1>&2
   exit 1
fi

# update and upgrade
apt update && apt -y upgrade

# and now reboot
reboot
Install Node Exporter
Then run the 02_exporter.sh script as root user to install official Node Exporter of Prometheus project from https://github.com/prometheus/node_exporter.
#!/bin/bash

# all packages are installed as root
if [[ $EUID -ne 0 ]]; then
   echo "This script must be run as root" 1>&2
   exit 1
fi

# install lts version of prometheus
VERSION="1.7.0"

# download
wget https://github.com/prometheus/node_exporter/releases/download/v${VERSION}/node_exporter-${VERSION}.linux-amd64.tar.gz

# extract contents and remove original archive
tar xvfz node_exporter-${VERSION}.linux-amd64.tar.gz && rm node_exporter-${VERSION}.linux-amd64.tar.gz

# change into extracted folder
pushd node_exporter-${VERSION}.linux-amd64

# move to bin and etc
mv node_exporter /usr/local/bin

# return to parent folder
popd

# and check exporter is installed
node_exporter --version

# now we will configure exporter to run as a system daemon, add a dedicated user
useradd -rs /bin/false node_exporter

# create systemctl service file
cat >/etc/systemd/system/node_exporter.service << EOL
[Unit]
Description=Node Exporter
Wants=network-online.target
After=network-online.target

[Service]
User=node_exporter
Group=node_exporter
Type=simple
Restart=on-failure
RestartSec=5s
ExecStart=/usr/local/bin/node_exporter

[Install]
WantedBy=multi-user.target
EOL

# reload the systemd, enable the service and check its status
systemctl daemon-reload
systemctl enable node_exporter
systemctl restart node_exporter

# good then
systemctl status node_exporter
Enable Perf Exporter
Then run the 03_perf.sh script as root user to enable built-in performance exporter of Web Safety ICAP service and Safe Browsing service.
#!/bin/bash

# all packages are installed as root
if [[ $EUID -ne 0 ]]; then
   echo "This script must be run as root" 1>&2
   exit 1
fi

# for now just enable the perf service which comes with web safety
systemctl enable wsperfd
systemctl restart wsperfd

# good then
systemctl status wsperfd
Install Squid Exporter
Then run the 04_squid.sh script as root user to install the Squid Exporter from https://github.com/boynux/squid-exporter.
#!/bin/bash

# all packages are installed as root
if [[ $EUID -ne 0 ]]; then
   echo "This script must be run as root" 1>&2
   exit 1
fi

# version of squid exporter
VERSION="1.11.0"

# download
wget https://github.com/boynux/squid-exporter/releases/download/v${VERSION}/squid-exporter-linux-amd64

# rename
mv squid-exporter-linux-amd64 squid-exporter && chmod +x squid-exporter

# move to bin
mv squid-exporter /usr/local/bin/

# and check exporter is installed
squid-exporter --version

# create systemctl service file
cat >/etc/systemd/system/squid_exporter.service << EOL
[Unit]
Description=Squid Exporter for Prometheus
Wants=network-online.target
After=network-online.target

[Service]
User=proxy
Group=proxy
Type=simple
Restart=on-failure
RestartSec=5s
ExecStart=/usr/local/bin/squid-exporter -squid-hostname "localhost" -squid-port 3128 -listen "127.0.0.1:9102"
StandardOutput=append:/opt/websafety/var/log/squid_exporter.log
StandardError=append:/opt/websafety/var/log/squid_exporter.log

[Install]
WantedBy=multi-user.target
EOL

# reload the systemd, enable the service and check its status
systemctl daemon-reload
systemctl enable squid_exporter
systemctl restart squid_exporter

# good then
systemctl status squid_exporter
Install Process Exporter
Next run the 05_process.sh script as root user to install the Process Exporter from https://github.com/ncabatoff/process-exporter.
#!/bin/bash

# all packages are installed as root
if [[ $EUID -ne 0 ]]; then
   echo "This script must be run as root" 1>&2
   exit 1
fi

# version of squid exporter
VERSION="0.8.2"

# download
wget https://github.com/ncabatoff/process-exporter/releases/download/v${VERSION}/process-exporter-${VERSION}.linux-amd64.tar.gz

# extract contents and remove original archive
tar xvfz process-exporter-${VERSION}.linux-amd64.tar.gz && rm process-exporter-${VERSION}.linux-amd64.tar.gz

# change into extracted folder
pushd process-exporter-${VERSION}.linux-amd64

# make executable
chmod +x process-exporter

# move to bin
mv process-exporter /usr/local/bin/

# return to parent folder
popd

# check exporter is installed
process-exporter --version

# create yaml to export info about wsicapd
cp process_exporter.yml /opt/websafety/etc/perf/

# and set the owner
chown proxy:proxy /opt/websafety/etc/perf/process_exporter.yml

# create systemctl service file
cat >/etc/systemd/system/process_exporter.service << EOL
[Unit]
Description=Process Exporter for Prometheus
Wants=network-online.target
After=network-online.target

[Service]
User=proxy
Group=proxy
Type=simple
Restart=on-failure
RestartSec=5s
ExecStart=/usr/local/bin/process-exporter -config.path /opt/websafety/etc/perf/process_exporter.yml --web.listen-address=127.0.0.1:9103
StandardOutput=append:/opt/websafety/var/log/process_exporter.log
StandardError=append:/opt/websafety/var/log/process_exporter.log

[Install]
WantedBy=multi-user.target
EOL

# reload the systemd, enable the service and check its status
systemctl daemon-reload
systemctl enable process_exporter
systemctl restart process_exporter

# good then
systemctl status process_exporter
The process exporter will collect metrics from main Web Safety services as shown by the following configuration file.
process_names:
  - comm:
    - squid
    - wsicapd
    - gsbd
    - wssyncd
    - ytguard
    - perfd
Integrate and Expose Exporters
Each exporter runs as a separate service and exports its metrics on the local IP address 127.0.0.1 (various ports). To combine those metrics and expose them to the public world we will use the same Apache instance which runs Web Safety Admin UI. To do that run the 06_apache.sh script as root.
#!/bin/bash

# all packages are installed as root
if [[ $EUID -ne 0 ]]; then
   echo "This script must be run as root" 1>&2
   exit 1
fi

# enable mod proxy
a2enmod proxy
a2enmod proxy_http

# copy the exporters.conf to apache sites available
cp -f exporters.conf /etc/apache2/sites-available/
cp -f exporters_port.conf /etc/apache2/conf-available/

# enable the site
a2ensite exporters
a2enconf exporters_port

# reload apache and check its status
systemctl restart apache2
systemctl status apache2

# good then dump the metrics
curl http://127.0.0.1:9090/metrics/node
curl http://127.0.0.1:9090/metrics/perf
curl http://127.0.0.1:9090/metrics/squid
curl http://127.0.0.1:9090/metrics/process

# ok then
echo "exporters configured successfully"
The script will adjust the existing Apache configuration and open the port 9090 which will expose all metrics on several URLs.
<VirtualHost *:9090>

    ServerName prometheus

    CustomLog /var/log/apache2/prometheus_access.log combined
    ErrorLog /var/log/apache2/prometheus_error.log
    LogLevel debug

    ProxyRequests Off
    <Proxy *>
        Allow from all
    </Proxy>

    ProxyErrorOverride On
    ProxyPass /metrics/node    http://127.0.0.1:9100/metrics
    ProxyPass /metrics/perf    http://127.0.0.1:9101/metrics
    ProxyPass /metrics/squid   http://127.0.0.1:9102/metrics
    ProxyPass /metrics/process http://127.0.0.1:9103/metrics

</VirtualHost>
Verify Exporters
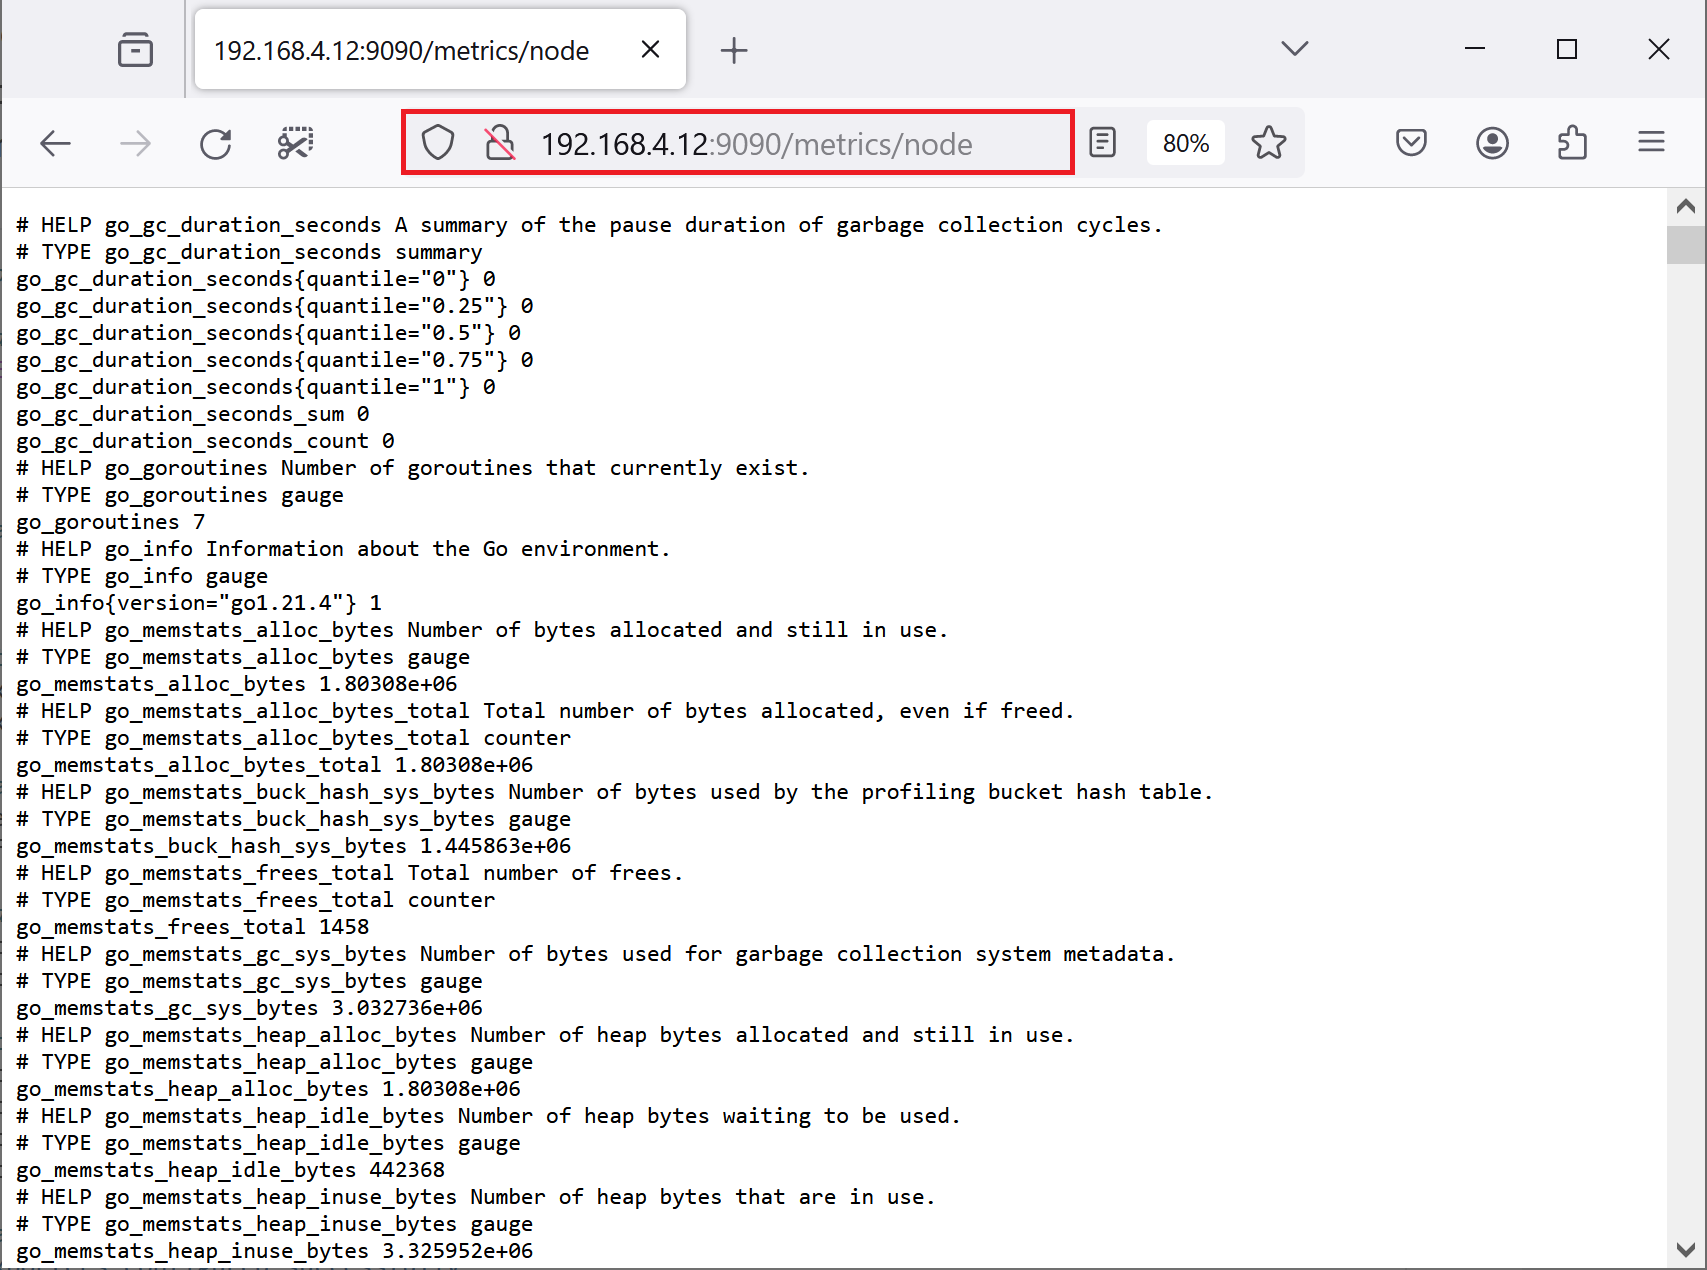
To check the metrics are working, you can access the following URLs on each of the Web Safety appliance (here is the example for 192.168.4.12).
The following screenshot shows metrics of the node of 192.168.4.12 appliance.