Install Prometheus
Prometheus server will need to be installed on a separate virtual machine (we will call it monitoring server in this tutorial). In our examples below we will assume that Ubuntu 22.04 LTS was deployed as virtual machine for running Prometheus and Grafana.
IP address of that monitoring server will be 192.168.10.5/24, gateway 192.168.10.1 and you would need to adjust this as needed for your specific deployment of course.
First, download the server installation scripts from our GitHub repository. After that, run 01_update.sh script as root user to update the underlying operating system of this virtual machine.
#!/bin/bash

# update should be done as root
if [[ $EUID -ne 0 ]]; then
   echo "This script must be run as root" 1>&2
   exit 1
fi

# add universe repo
add-apt-repository -y universe

# update and upgrade
apt update && apt -y upgrade

# and now reboot
reboot
And then run 02_prometheus.sh as root user to actually install the Prometheus server.
#!/bin/bash

# all packages are installed as root
if [[ $EUID -ne 0 ]]; then
   echo "This script must be run as root" 1>&2
   exit 1
fi

# install lts version of prometheus
VERSION="2.45.4"

# download
wget https://github.com/prometheus/prometheus/releases/download/v${VERSION}/prometheus-${VERSION}.linux-amd64.tar.gz

# extract contents and remove original archive
tar xvfz prometheus-${VERSION}.linux-amd64.tar.gz && rm prometheus-${VERSION}.linux-amd64.tar.gz

# create folders to install
mkdir /etc/prometheus /var/lib/prometheus

# change into extracted folder
pushd prometheus-${VERSION}.linux-amd64

# move to bin and etc
mv prometheus promtool /usr/local/bin/
mv prometheus.yml /etc/prometheus/prometheus.yml
mv consoles/ console_libraries/ /etc/prometheus/

# return to parent folder
popd

# and check prometheus is installed
prometheus --version

# now we will configure prometheus to run as a system daemon, add a dedicated user
useradd -rs /bin/false prometheus

# and make it owner
chown -R prometheus: /etc/prometheus /var/lib/prometheus

# create systemctl service file
cat >/etc/systemd/system/prometheus.service << EOL
[Unit]
Description=Prometheus
Wants=network-online.target
After=network-online.target

[Service]
User=prometheus
Group=prometheus
Type=simple
Restart=on-failure
RestartSec=5s
ExecStart=/usr/local/bin/prometheus \
    --config.file /etc/prometheus/prometheus.yml \
    --storage.tsdb.path /var/lib/prometheus/ \
    --web.console.templates=/etc/prometheus/consoles \
    --web.console.libraries=/etc/prometheus/console_libraries \
    --web.listen-address=0.0.0.0:9090 \
    --web.enable-lifecycle \
    --log.level=info

[Install]
WantedBy=multi-user.target
EOL

# reload the systemd, enable the service and check its status
systemctl daemon-reload
systemctl enable prometheus
systemctl restart prometheus

# good then
systemctl status prometheus
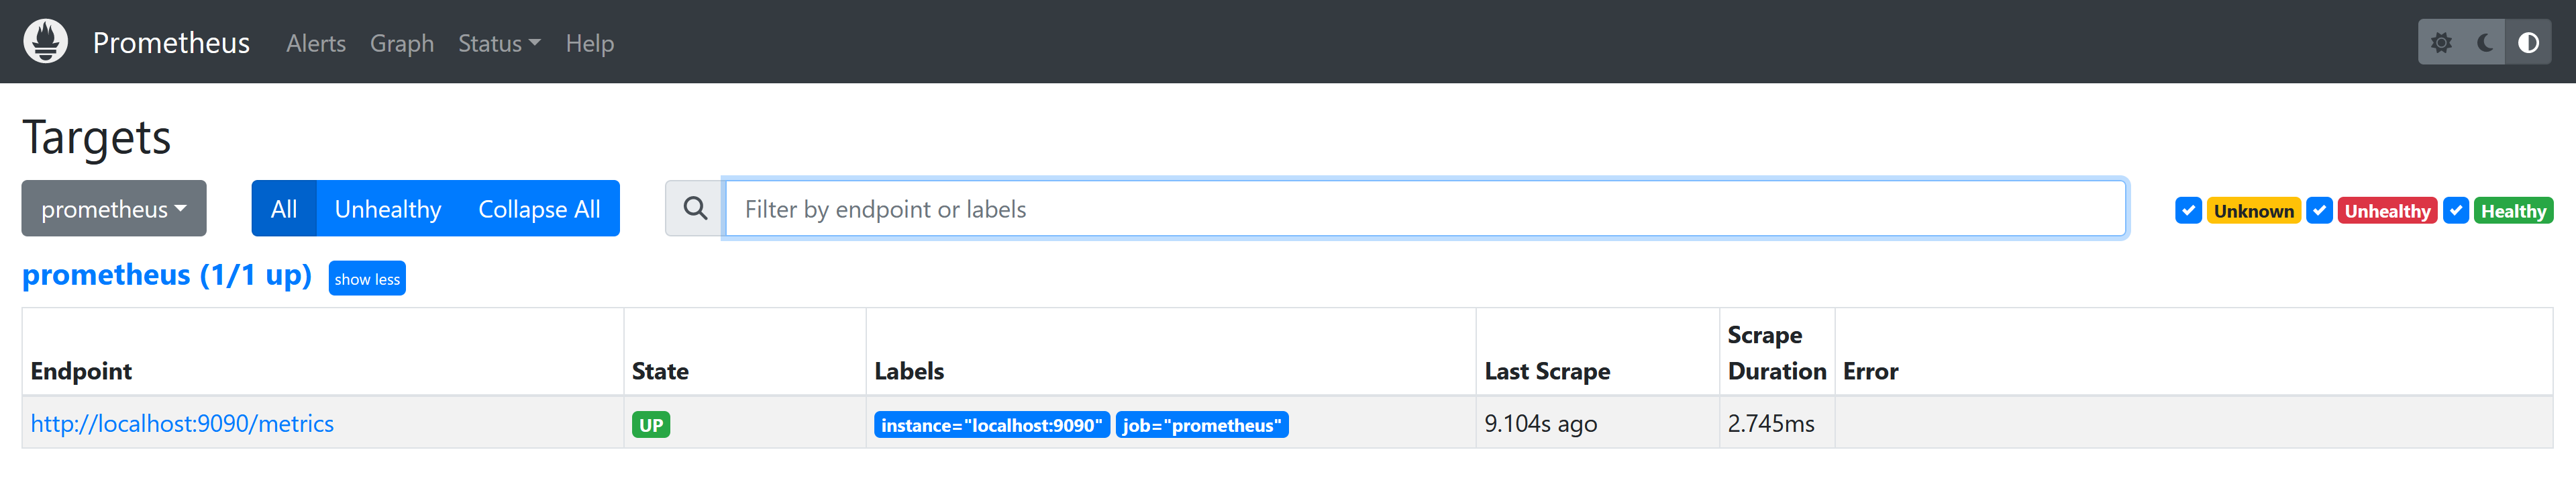
After this script finishes successfully, systemctl status prometheus command should show running Prometheus server and Prometheus Admin UI should also be visible at the IP address of the monitoring server, port 9090.
* prometheus.service - Prometheus
     Loaded: loaded (/etc/systemd/system/prometheus.service; enabled; vendor preset: enabled)
     Active: active (running) since Sun 2024-04-21 12:55:34 UTC; 1h 9min ago
   Main PID: 1356 (prometheus)
      Tasks: 8 (limit: 4558)
     Memory: 36.9M
        CPU: 3.067s
     CGroup: /system.slice/prometheus.service
             └─1356 /usr/local/bin/prometheus --config.file
                /etc/prometheus/prometheus.yml --storage.tsdb.path /var/lib/prometheus/
                   --web.console.templates=/etc/prometheus/consoles
                   --web.console.libraries=/etc/