High CPU Usage
The CPU usage gauge at the Dashboard of the Admin UI shows high CPU usage, what might be the reason?
First, we need to see what processes use a lot of CPU. This can be better done from the terminal console by running the following command top -cbn1 | head -30. The output will look something like this.
root@node12:~# top -cbn1 | head -30
top - 08:42:49 up 17 days, 15:14,  2 users,  load average: 0.07, 0.03, 0.01
Tasks: 334 total,   1 running, 258 sleeping,   0 stopped,   0 zombie
%Cpu(s):  1.0 us,  0.1 sy,  0.0 ni, 98.8 id,  0.1 wa,  0.0 hi,  0.0 si,  0.0 st
KiB Mem :  4039672 total,   110324 free,  2708212 used,  1221136 buff/cache
KiB Swap:  4039676 total,  3700476 free,   339200 used.  1135548 avail Mem

  PID USER      PR  NI    VIRT    RES    SHR S  %CPU %MEM     TIME+ COMMAND
11213 root      20   0   58644  18200   8304 D  12.5  0.5   0:00.18 python3 /opt/websafety-ui/bin/collector.py
 1308 websafe+  20   0  363180  44740   7068 S   6.2  1.1 385:45.10 python3 /opt/websafety-ui/bin/realtime.py
11216 root      20   0   42944   3984   3224 R   6.2  0.1   0:00.01 top -cbn1
    1 root      20   0  225600   6712   4548 S   0.0  0.2   0:10.05 /sbin/init maybe-ubiquity
    2 root      20   0       0      0      0 S   0.0  0.0   0:00.07 [kthreadd]
    4 root       0 -20       0      0      0 I   0.0  0.0   0:00.00 [kworker/0:0H]
    6 root       0 -20       0      0      0 I   0.0  0.0   0:00.00 [mm_percpu_wq]
    7 root      20   0       0      0      0 S   0.0  0.0   0:09.98 [ksoftirqd/0]
    8 root      20   0       0      0      0 I   0.0  0.0   2:36.08 [rcu_sched]
    9 root      20   0       0      0      0 I   0.0  0.0   0:00.00 [rcu_bh]
   10 root      rt   0       0      0      0 S   0.0  0.0   0:00.77 [migration/0]
   11 root      rt   0       0      0      0 S   0.0  0.0   0:01.57 [watchdog/0]
   12 root      20   0       0      0      0 S   0.0  0.0   0:00.00 [cpuhp/0]
   13 root      20   0       0      0      0 S   0.0  0.0   0:00.00 [cpuhp/1]
   14 root      rt   0       0      0      0 S   0.0  0.0   0:01.50 [watchdog/1]
   15 root      rt   0       0      0      0 S   0.0  0.0   0:00.48 [migration/1]
   16 root      20   0       0      0      0 S   0.0  0.0   0:06.03 [ksoftirqd/1]
   18 root       0 -20       0      0      0 I   0.0  0.0   0:00.00 [kworker/1:0H]
   19 root      20   0       0      0      0 S   0.0  0.0   0:00.00 [kdevtmpfs]
   20 root       0 -20       0      0      0 I   0.0  0.0   0:00.00 [netns]
   21 root      20   0       0      0      0 S   0.0  0.0   0:00.00 [rcu_tasks_kthre]
   22 root      20   0       0      0      0 S   0.0  0.0   0:00.00 [kauditd]
   24 root      20   0       0      0      0 S   0.0  0.0   0:01.64 [khungtaskd]
Look at the COMMAND column - it might give you the answer right away. The following events have been previously reported by our support team as possible reasons for high CPU usage.
Kerberos Replay Cache
There were reports of high CPU usage when Kerberos replay cache is used. Try setting the [X] Disable Kerberos replay cache checkbox in Admin UI / Squid / Auth / Active Directory Integration / Kerberos.
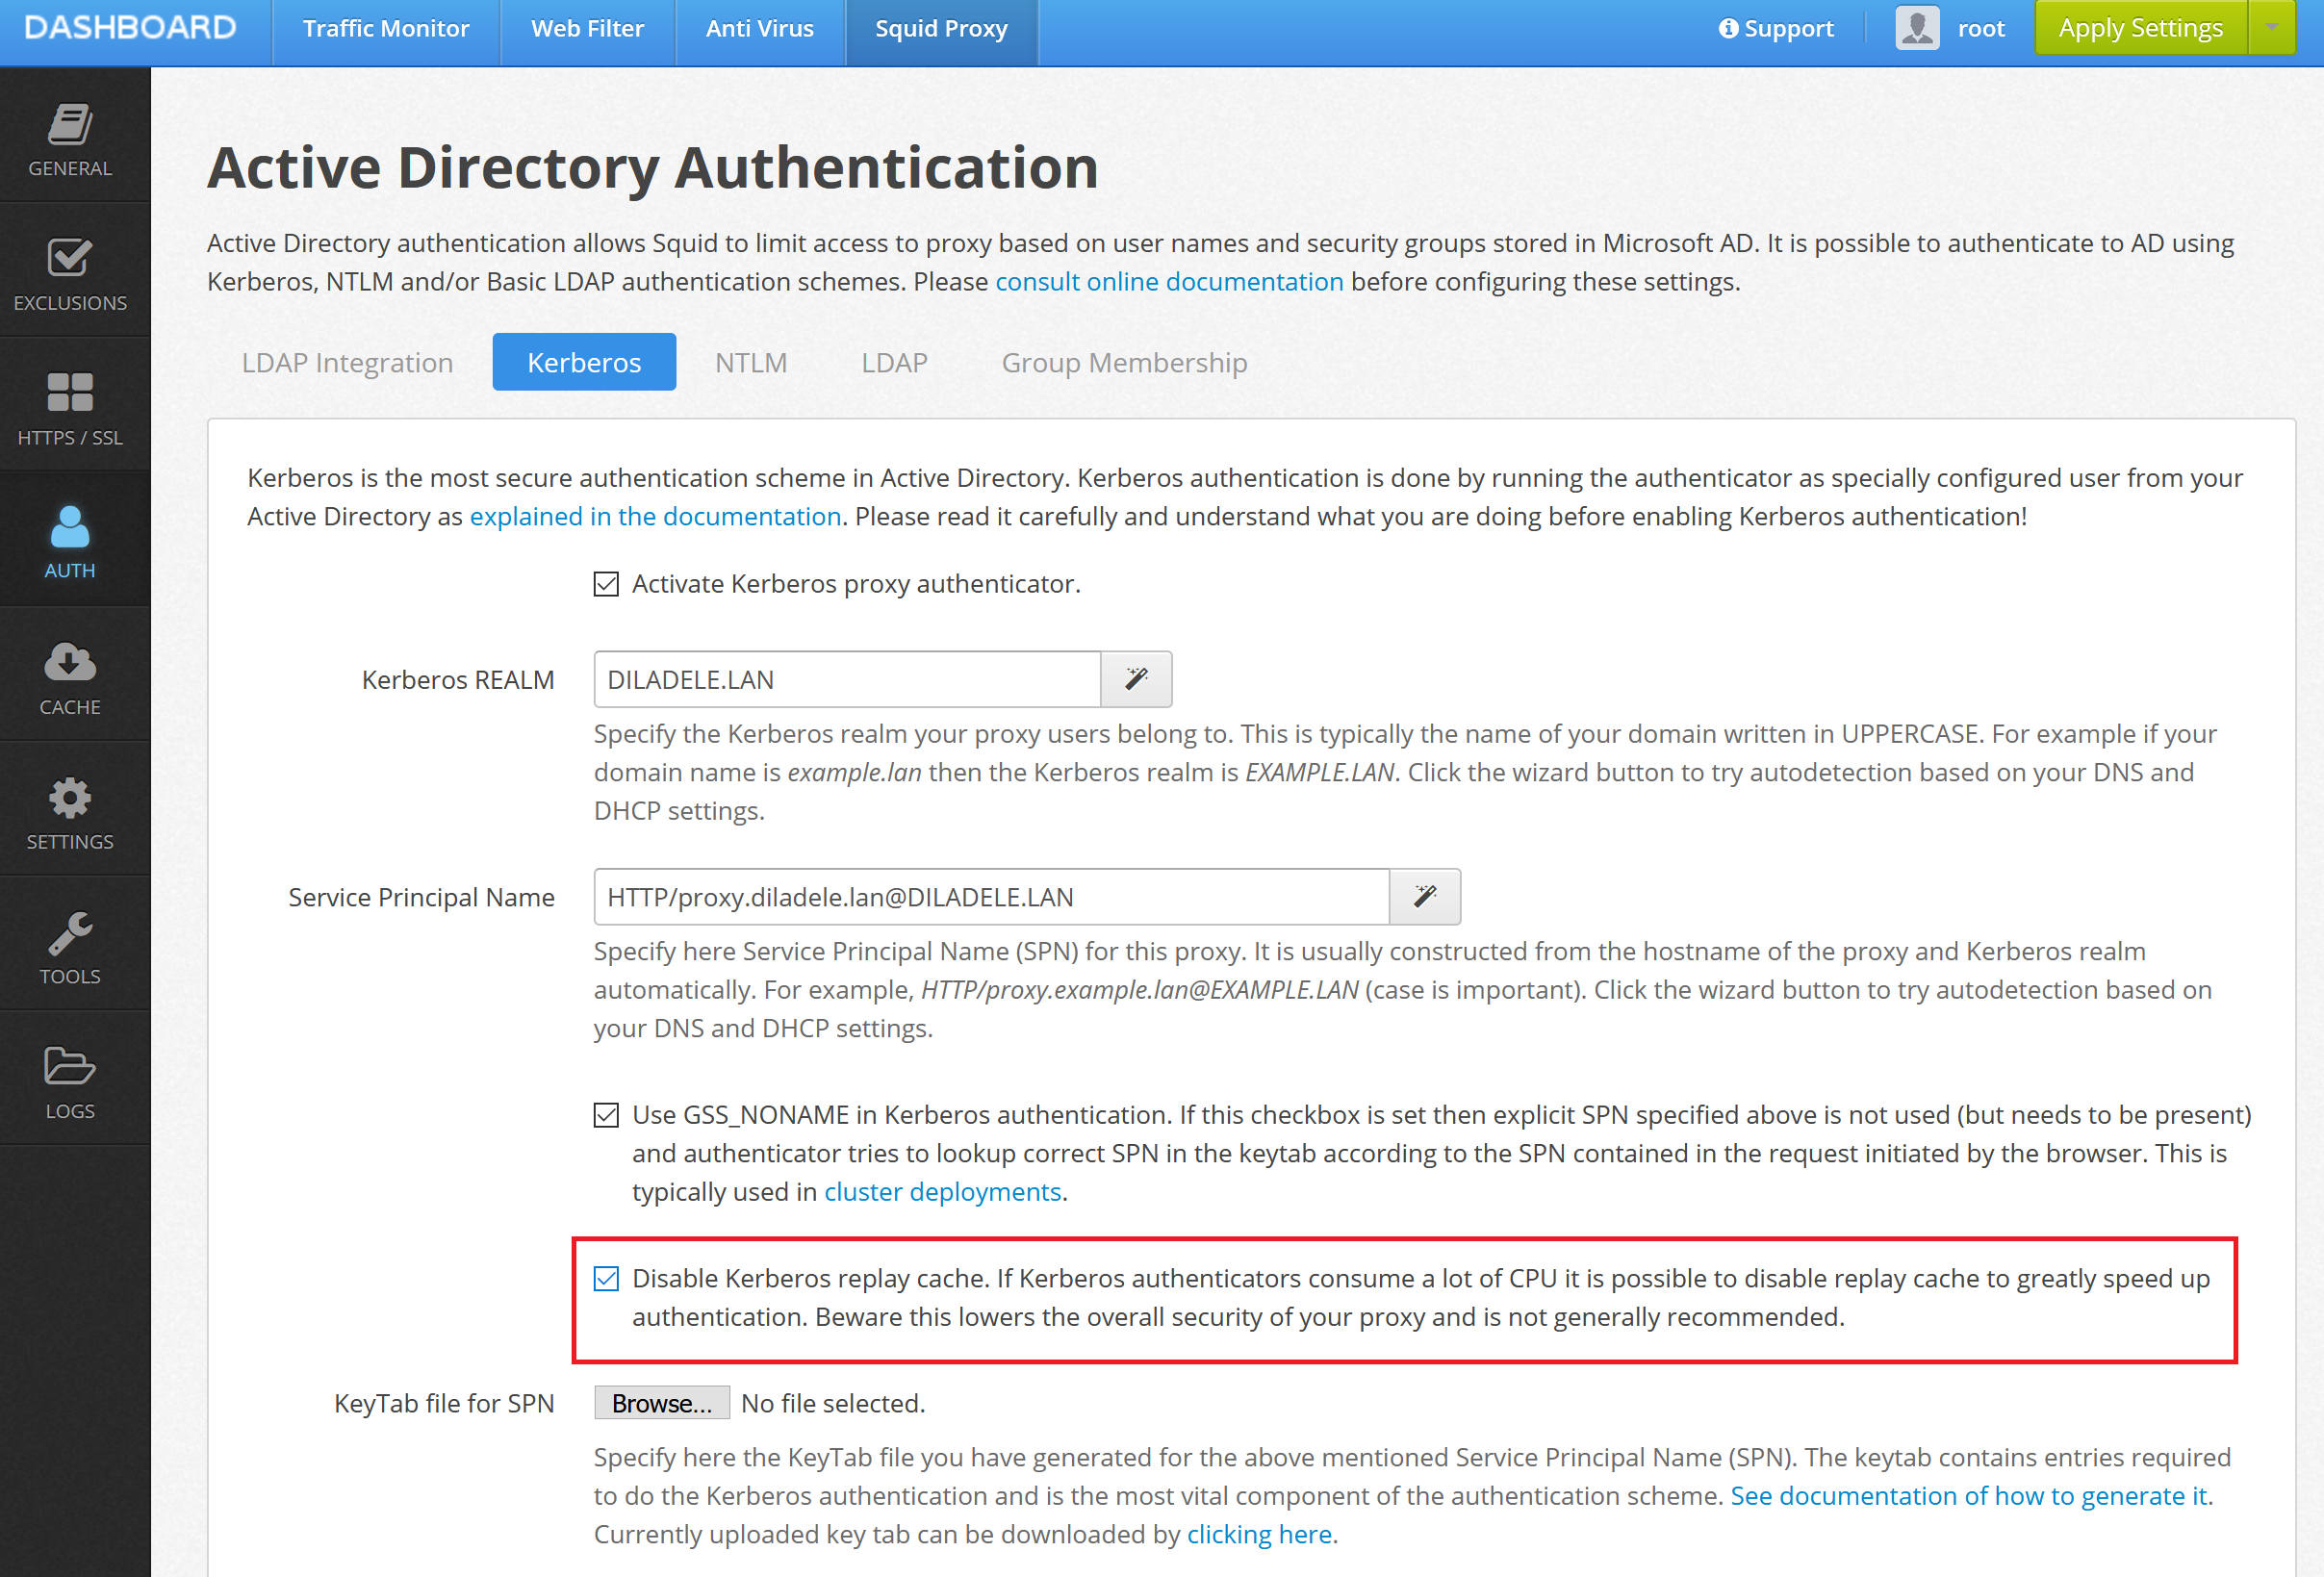
Save and Restart from Admin UI and see if the high CPU usage continues.
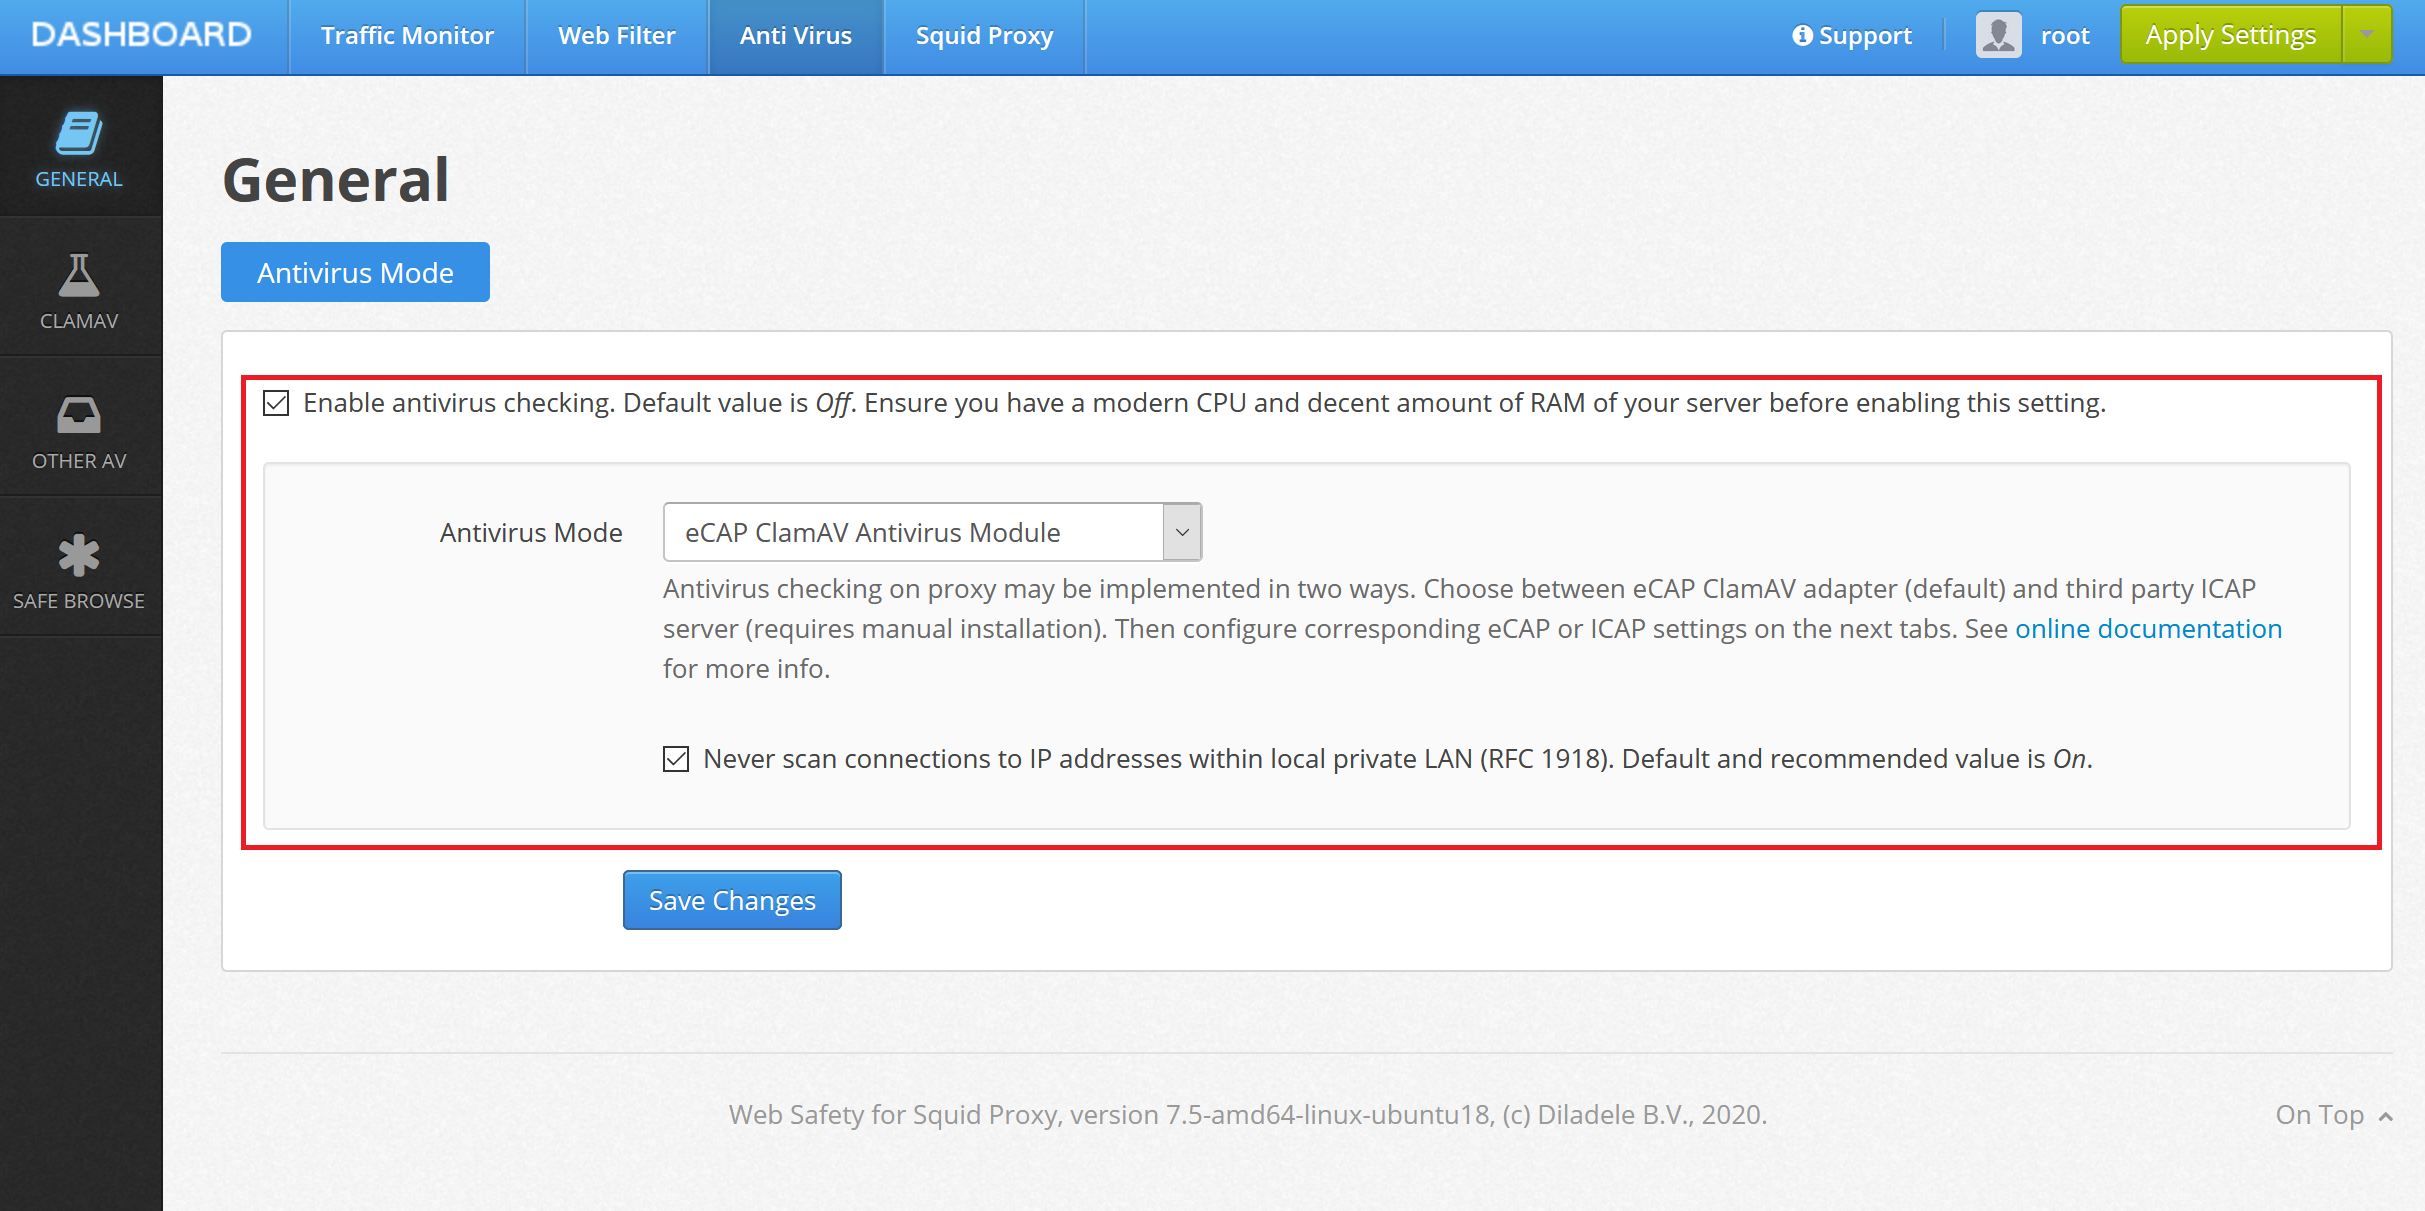
ClamAV Anti-Virus Database Reload
If you have enabled anti-virus scanning using eCAP then each restart/reload of the Squid proxy daemon will temporary cause high CPU usage when anti-virus definition files are reloaded. This usually takes around 2 minutes during which time Squid proxy may be inaccessible.
Traffic Reporting
Also see if reporting module might be building the daily reports (the cron job at /etc/cron.daily/websafety_report starts at 06:00 in the morning and continues until it finishes). Although the reporting module is optimized and only builds new reports for newly collected data - depending on how many clients are using the proxy this may still be the limiting factor.
Try limiting the log retention settings and ignoring some non essential information from the logs. See Squid Log Retention Settings article for more information.