Customized Periodic Reporting
It is also possible to build several types of custom reports over user defined data range and with additional parameters. Available report type are shown in the following table. Parameters that can be customized are included and excluded domain names, user names, IP addresses and policies. Custom reports can also be sent to specified e-mail addresses.
Web Sites
Report Name |
Description |
|---|---|
Top Sites By Size |
Web sites with the most bandwidth consumed. |
Top Sites By Hits |
Web sites with the most web requests. |
Blocked Sites |
Blocked sites with the most web requests and count of users. |
Offensive Sites |
Offensive sites with the most web requests and count of users. |
Users
Report Name |
Description |
|---|---|
Top Users By Size |
Users with the most bandwidth consumed. |
Top Users By Hits |
Users with the most web requests. |
Blocked Users |
Users who visited the most blocked domains. |
Offensive Users |
Users who visited the most offensive domains. |
Search Queries |
Information about most common queries in search engines. |
Youtube Videos |
Information about most commonly watched Youtube videos. |
Categories
Report Name |
Description |
|---|---|
Detected Categories |
Site categories sorted by the most web requests and number of users. |
Policies
Report Name |
Description |
|---|---|
Triggered Policies |
Policies sorted by the most web requests and number of users. |
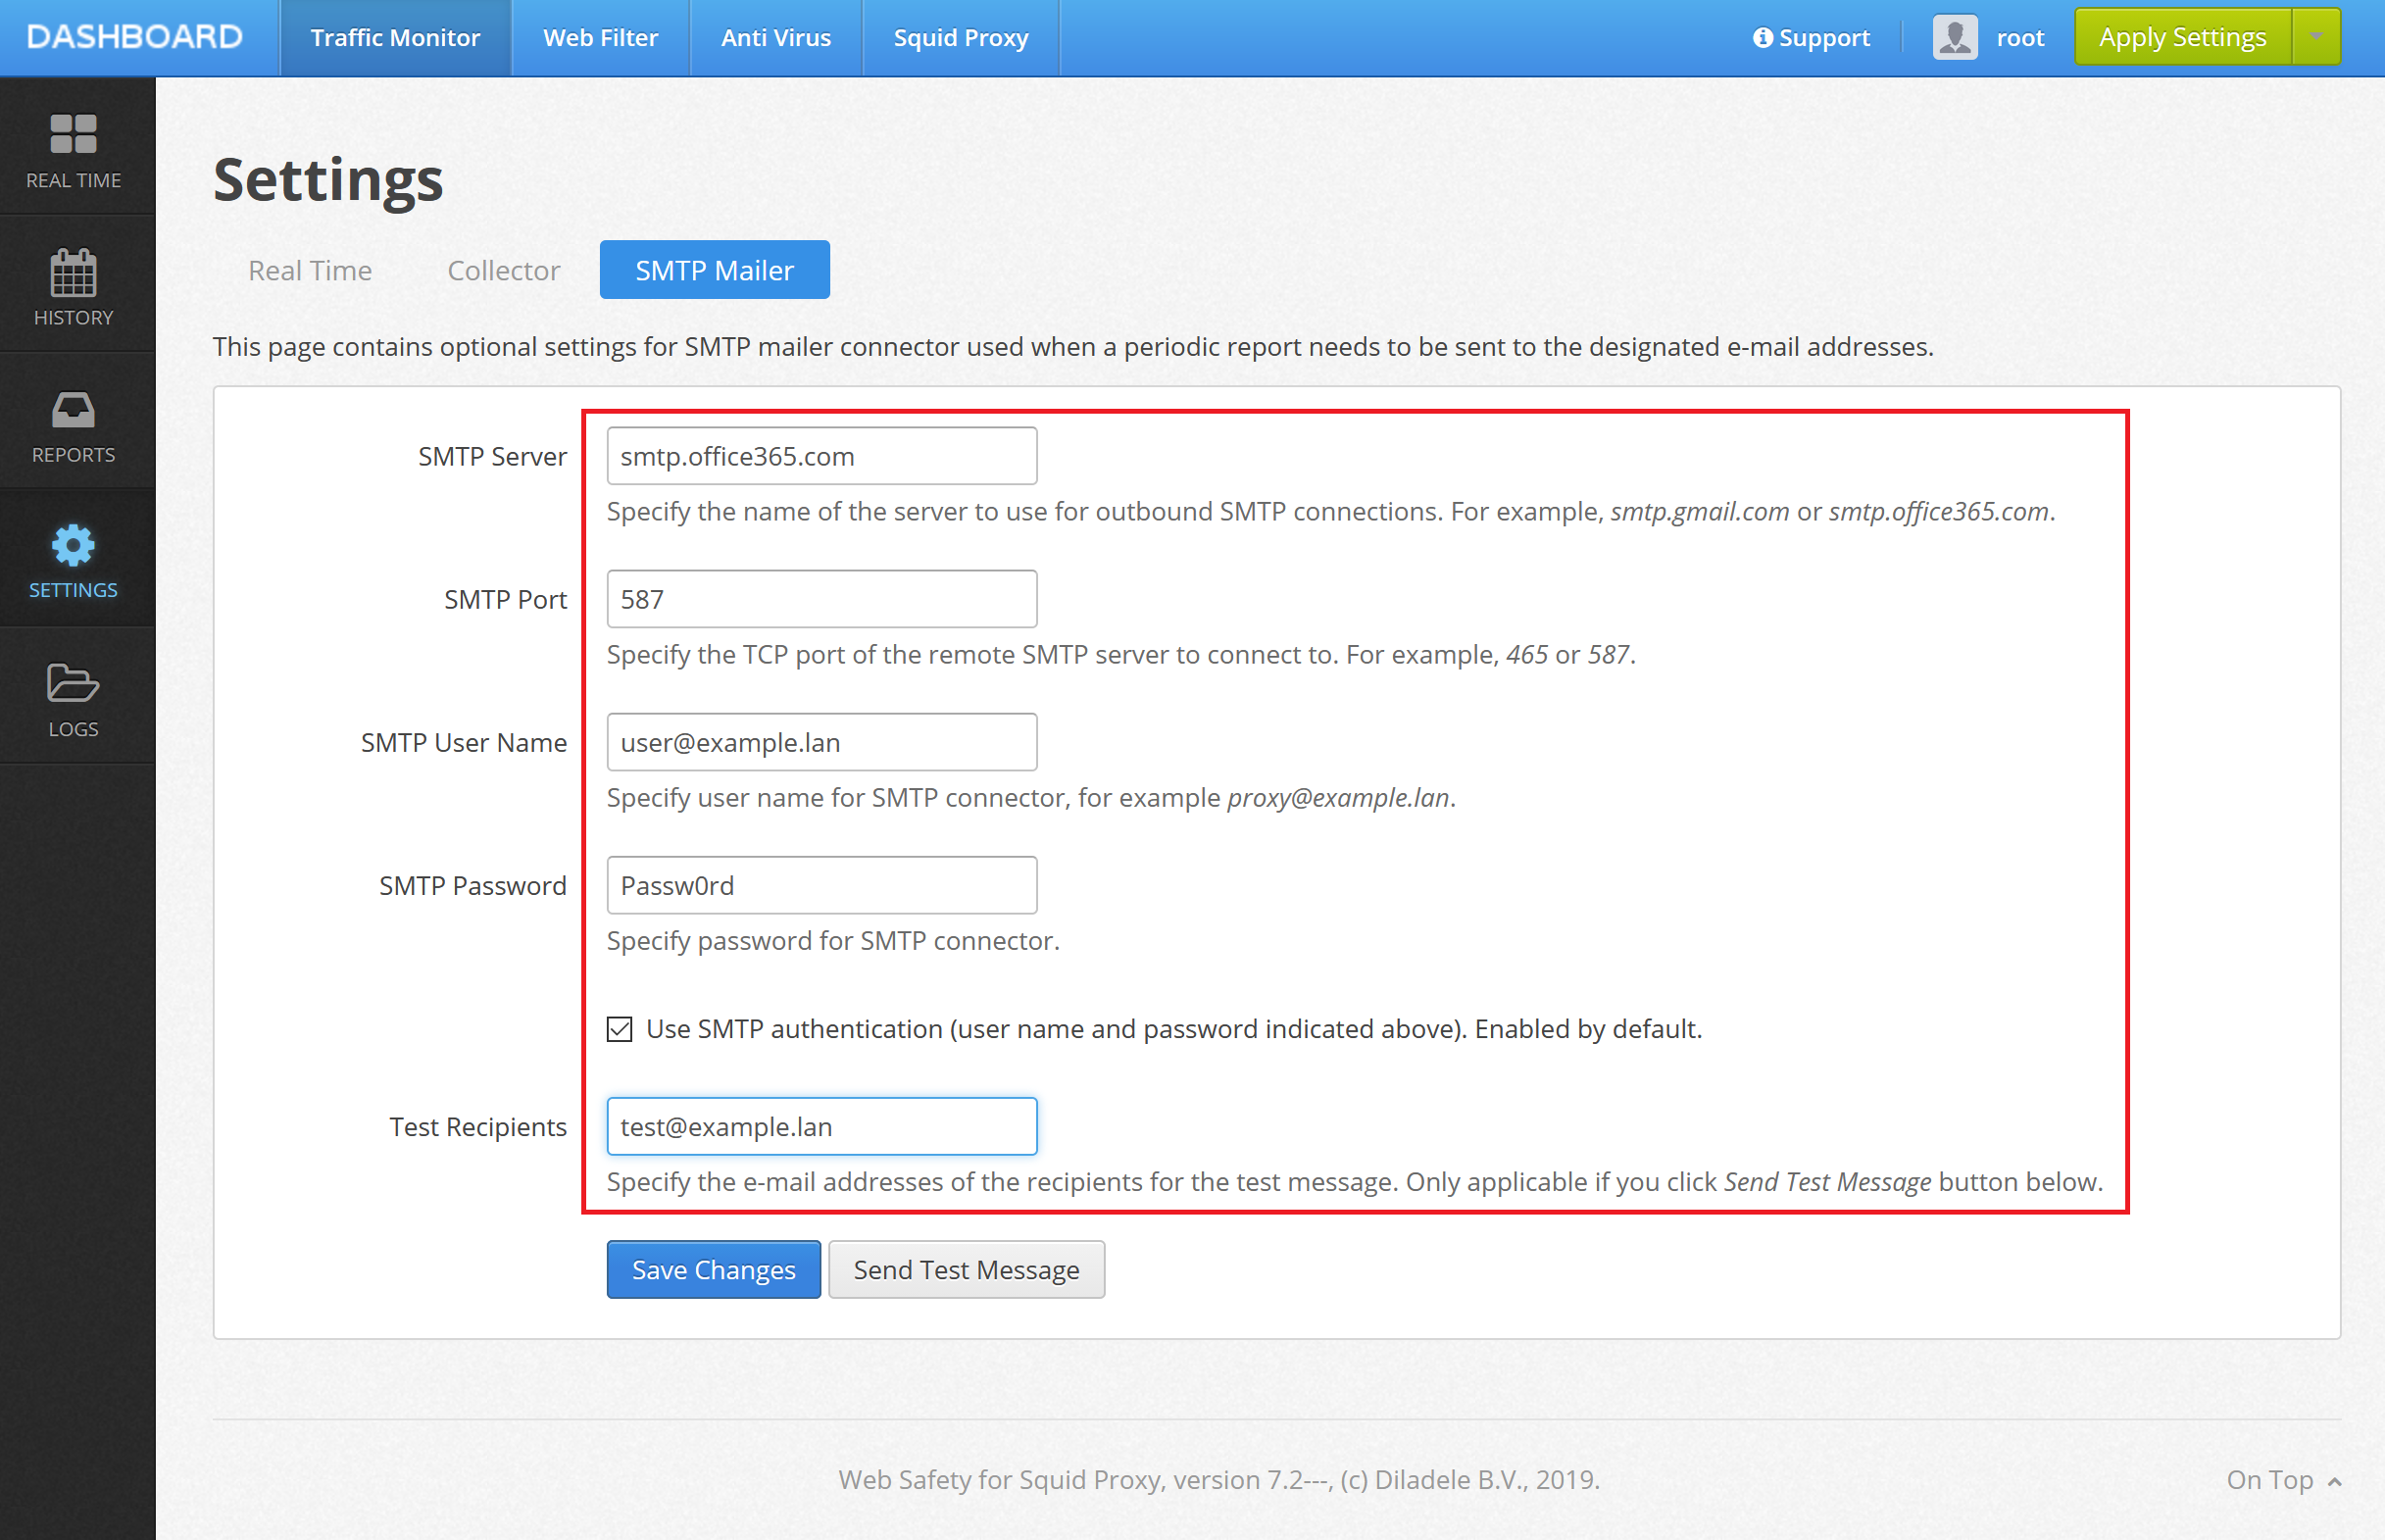
In order to configure the SMTP connector settings for custom reports, navigate to UI / Traffic Monitor / Settings / SMTP Connector and fill in all fields. You can also press Send Test Message button to verify everything works as expected.

Note the scheduling of custom reports is done using entries in custom cron file at /etc/cron.d/websafety_periodic. When trying to understand why reports possibly are not run, use the following command to study cron output.
tail -f /var/log/syslog | grep CRON